
Chemical Technology, Control and Management Chemical Technology, Control and Management
Volume 2020 Issue 3 Article 4
7-4-2020
MODELING OF MONITORING SYSTEMS OF SOLAR POWER MODELING OF MONITORING SYSTEMS OF SOLAR POWER
STATIONS FOR TELECOMMUNICATION FACILITIES BASED ON STATIONS FOR TELECOMMUNICATION FACILITIES BASED ON
WIRELESS NETS WIRELESS NETS
Ilkhomjon Xakimovich Siddikov
Department of Power supply systems, Tashkent University of Information Technologies, Uzbekistan,
Address: Prospect A.Timur-108, 100202, Tashkent city, Republic of Uzbekistan
Khalimjon Ergashevich Khujamatov
Tashkent University of Information Technology Address: 108 Amir Temur st.,100000, Tashkent city,
Republic of Uzbekistan
Doston Turayevich Khasanov
Tashkent University of Information Technology Address: 108 Amir Temur st.,100000, Tashkent city,
Republic of Uzbekistan E-mail: [email protected], Phone: +998 94 348 7030.
,
Ernazar Nurjamiyevich Reypnazarov
Tashkent University of Information Technology Address: 108 Amir Temur st.,100000, Tashkent city,
Republic of Uzbekistan
Follow this and additional works at: https://ijctcm.researchcommons.org/journal
Part of the Computer Sciences Commons, Industrial Technology Commons, and the Process Control
and Systems Commons
Recommended Citation Recommended Citation
Siddikov, Ilkhomjon Xakimovich; Khujamatov, Khalimjon Ergashevich; Khasanov, Doston Turayevich; and
Reypnazarov, Ernazar Nurjamiyevich (2020) "MODELING OF MONITORING SYSTEMS OF SOLAR POWER
STATIONS FOR TELECOMMUNICATION FACILITIES BASED ON WIRELESS NETS,"
Chemical Technology,
Control and Management
: Vol. 2020: Iss. 3, Article 4.
DOI: https://doi.org/10.34920/2020.3.20-28
This Article is brought to you for free and open access by Chemical Technology, Control and Management. It has
been accepted for inclusion in Chemical Technology, Control and Management by an authorized editor of Chemical
Technology, Control and Management. For more information, please contact [email protected].
ISSN 1815-4840
Himičeskaâ tehnologiâ. Kontrolʹ i upravlenie
СHEMICAL TECHNOLOGY.
CONTROL AND MANAGEMENT
2020, №3 (93) pp.20-28. https://doi.org/10.34920/2020.3.20-28
International scientific and technical journal
journal homepage: https://uzjournals.edu.uz/ijctcm/
Since 2005
UDC 621.314
MODELING OF MONITORING SYSTEMS OF SOLAR POWER STATIONS FOR
TELECOMMUNICATION FACILITIES BASED ON WIRELESS NETS
Siddikov Ilkhomjon Xakimovich
1
, Khujamatov Khalimjon Ergashevich
2
,
Khasanov Doston Turayevich
3
, Reypnazarov Ernazar Nurjamiyevich
4
1,2,3,4
Tashkent University of Information Technology
Address: 108 Amir Temur st.,100000, Tashkent city, Republic of Uzbekistan
E-mail:
3
dhasanov0992@gmail.com, Phone: +998 94 348 7030.
Abstract: In this paper described of modelling processes of the real-time remote monitoring system of solar power
sources, modelled and investigated by wireless sensor nets of telecommunications devices. As a modelling environment was
obtained Proteus software. In processes of modelling of the system, structure and a block diagram of the system were
developed, each of elements is deleted to parts of the system and separately described. Specially created software for the
research system. The structure of the system developed and software tested by modelling processes. The results of
modelling of monitoring system presented in a virtual terminal, an oscillography, and a local web browser.
Keywords: Arduino board, Communication, real-time monitoring, solar power stations, monitoring, wireless
remote control, WSN, ZigBee.
Аннотация: Телекоммуникация қурилмалари қуёш энергия таъминоти манбаларини симсиз сенсор
тармоқлари орқали реал вақт мобайнида масофали мониторинг қилиш тизими моделлаштирилган ва тадқиқ
этилган. Моделлаштириш учун Proteus дастурий муҳити олинган. Тизимни моделлаштириш жараёнида тизим
структураси ва блок схемаси ишлаб чиқилган, тизим таркибига кирувчи ҳар бир элементлар ҳақидаги тавсифлар
келтирилган. Тизим тадқиқоти учун тегишли дастурий таъминот яратилган. Ишлаб чиқилган структура ва
дастурий таъминот моделлаштириш орқали тестдан ўтказилган. Моделлаштириш натижалари виртуал
терминал, осциллограф ва локал веб-браузерда келтирилган.
Таянч сўзлар: Arduino платаси, боғланиш, реал вақт бўйича мониторинг, қуёш электр станциялари,
симсиз масофавий бошқариш, WSN - симсиз сенсор тармоқ, ZigBee.
Аннотация: Приведены результаты исследования системы дистанционного мониторинга источников
солнечной энергии в реальном масштабе времени, с моделированы и исследованы беспроводные сенсорные сети
телекоммуникационных устройств. В качестве среды моделирования принята программная среда Proteus. При
моделировании разработаны структура системы, элементы которой являются частями исследуемой системы.
Приведены материалы разработанного программного обеспечения исследуемой системы. Разработанная
структура и программное обеспечение протестированы на основе практических экспериментов. Результаты
моделирования представлены в виртуальном терминале, осциллографе и локальном веб-браузере.
Ключевые слова: Плата Arduino, связь, мониторинг в реальном времени, солнечные электростанции,
беспроводное дистанционное управление, WSN, ZigBee.
1. Introduction
Presently Smart Grid - smart energy systems are using to provide a stable and high-quality
power supply of telecommunication facilities. This leads to solving many problems, including remote
monitoring, two-way information systems, energy consumption controls, demand to increasing energy,
to provide reliability and security [1,11].
Real-time remote monitoring of solar power sources of telecommunication devices through
wireless sensor nets are basis of Smart Grid power supply system’s [2,14].

CONTROL OF TECHNOLOGICAL PARAMETERS
21
For real-time remote monitoring of solar power sources of telecommunication devices through
wireless sensor nets is required remote monitoring of solar panel voltage, current, light illumination,
dusting, environment and battery temperature, battery current, battery voltage, and other types of
measurements of telecommunication devices. In remote monitoring of solar power sources through
wireless sensor nets, controller devices unit (CDU) receives relevant data from each sensor (how it is
used in real-time, in hours, in days, in weeks, etc.) [5].
The resulting data usually transferred to database (DB) and provide to personnel by mobile
communication via the Arduino Ethernet module or Arduino GSM module, view as SMS, as web
pages and other forms [6].
The collected data about operating mode during monitoring will be sent to monitoring center,
where responsible person can promptly admit a decision to correct of situation. Operational and
maintenance personnel will be able to quickly identify and fix cause of the malfunction, based on
detailed information from a set of technical tools installed in the monitoring system. In this case, by
reducing cost of recovery and downtime during preventive maintenance use of monitoring systems
will increase a reliability of telecommunications systems, which can be evaluated a coefficient of
technical maintenance [1-5].
A positive economic effect is achieved with use of monitoring systems, many actions aimed at
checking technical condition, at maintaining system's performance and at identifying causes of
malfunctions are performed remotely automated or automatically [6,8-12].
2. Statement of a Problem
For now, remote monitoring systems of existing solar energy sources is not an optimal solution
for real-time monitoring of energy sources of telecommunications facilities. Existing systems have a
number of technical limitations. The main reasons for this are [3]:
1. Use of optical fiber technologies in remote monitoring systems is not always desirable, as
telecommunications facilities are often located far away from monitoring center, in deserts, mountains,
forests and plains.
2. Monitoring system of energy sources of telecommunications facilities must promptly
transmit data in real-time, implementation of a preventive system aimed at troubleshooting and
diagnostics. This requires a secure and reliable connection to avoid serious failures and interruptions.
3. Keep monitored parameters on the local monitoring center's server (database). This data
collection allows us to research and predict failures and their timelines.
This research activity is focused on developing an optimal system for real-time remote
monitoring of solar power sources of telecommunication facilities through wireless sensor nets. Aims
at designing and simulating on system of Proteus environment, with a focused to technical constraints,
which arising from caused given above.
3. Main Part
When developing a Solar Power Plant Remote Monitoring System, important to take
information about all the parameters that apply to it. The main parameters for a solar power plant are
follows: solar panels power; amount of solar radiation; environment temperature; environment
humidity; voltage and current at controller output; controller temperature; voltage and current on the
battery; battery temperature; accumulator charge; voltage and current at load; required power of power
load. They define a basic characteristics of research system. The development of a monitoring system
on all parameters of e solar power plant was initially designed as a block diagram [2, 4, 7].
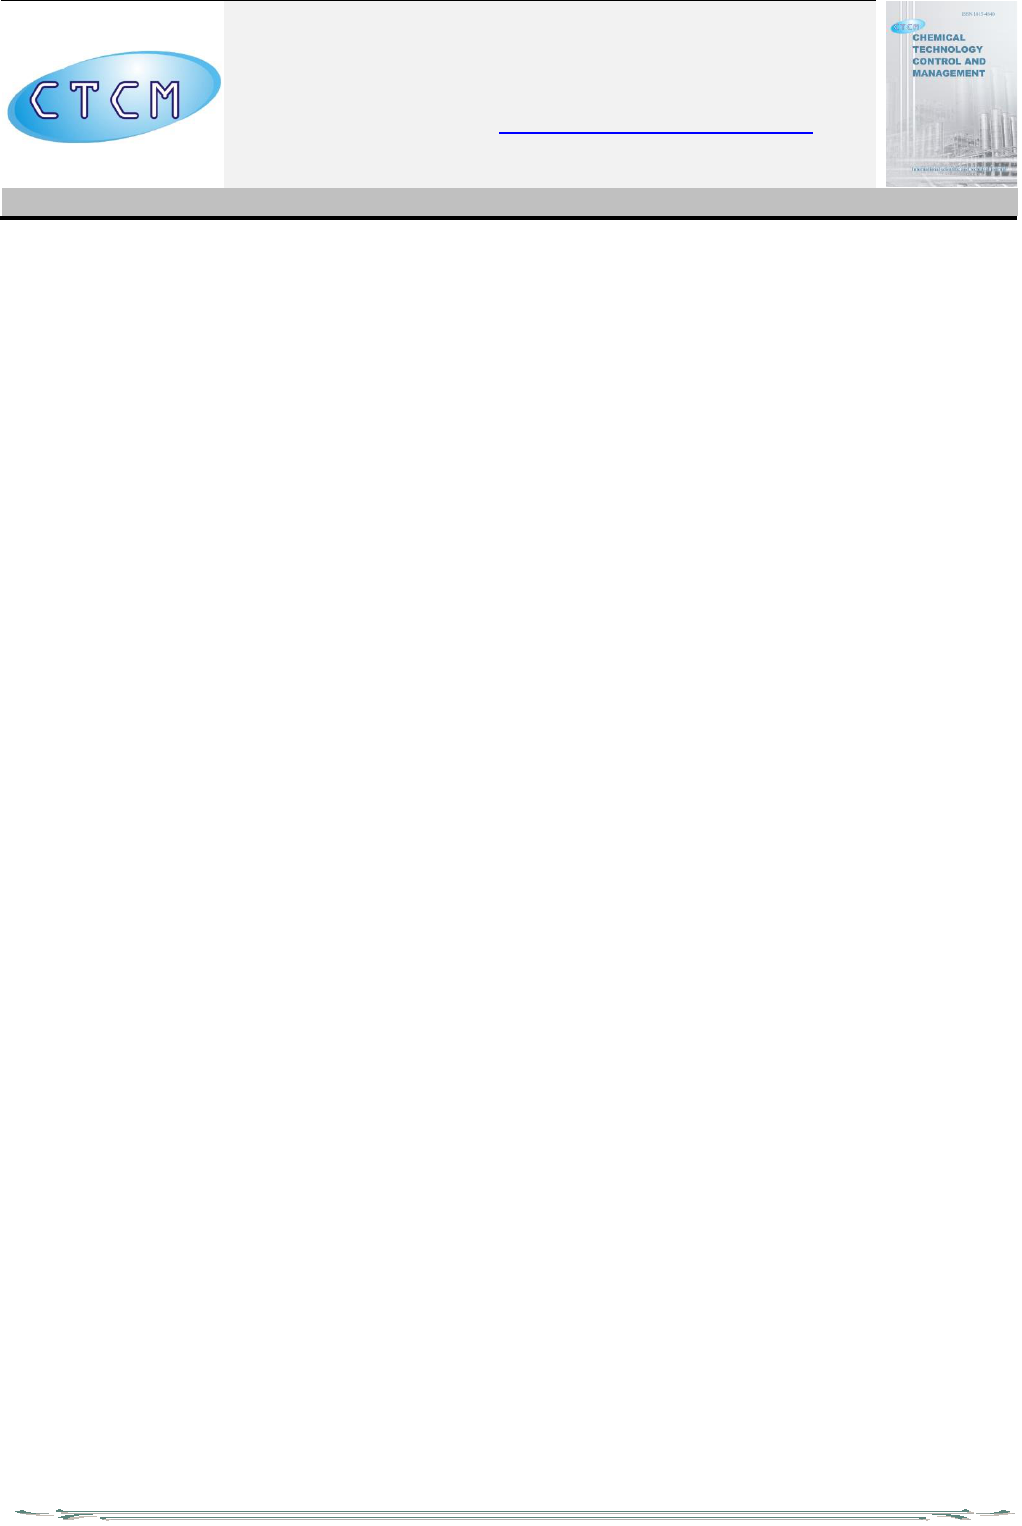
3.1. Block diagram of the monitoring system of solar station
The remote monitoring system of solar power sources through wireless sensor nets of
telecommunication facilities were conditionally divided into two parts: the data collection unit from
solar power station and monitoring center (Fig. 1 and Fig. 2).
The data collection unit from solar power plant consists following blocks (fig. 1):
CHEMICAL TECHNOLOGY. CONTROL AND MANAGEMENT. №3 / 2020
22
- solar panel;
- accumulator battery;
- voltage sensor;
- current sensor;
- humidity sensor;
- temperature sensor;
- light sensor;
- dust sensor;
- controller devices unit (Arduino UNO);
- wireless network module (ZigBee/Xbee);
- display;
- telecommunication objects (load).
Fig. 1. Block diagram of measuring and transmitting unit of monitoring system of solar power station.
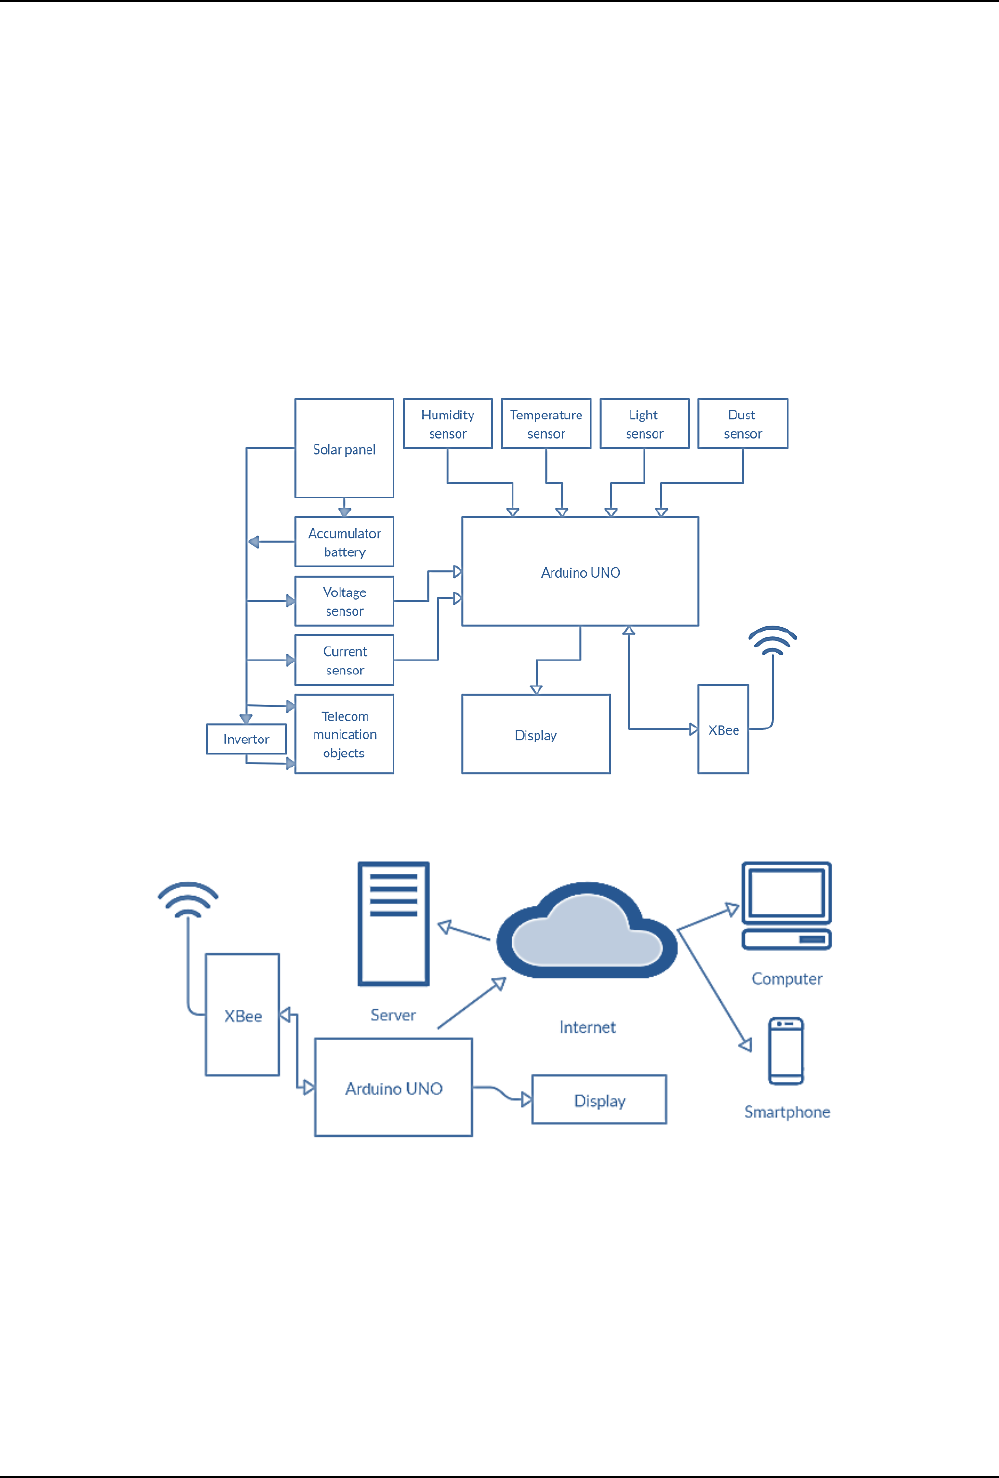
Fig. 2. Block diagram of receiving unit of monitoring system of solar power station.
The monitoring center consists following blocks (fig. 2):
- controller device unit (Arduino MEGA);
- wireless network module (ZigBee/Xbee);
- display;
- local server.
The monitoring center is also connected to Internet, where operator has access to rights
monitoring system assigned to it through any Internet-connected device [13, 15].

CONTROL OF TECHNOLOGICAL PARAMETERS
23
3.2. Hardware of monitoring system of solar power station
This chapter provides basic information about devices and modules used for designing and
modeling on the Proteus software environment as described above.
3.2.1. Solar panel
Solar panels are a semiconductor device, that converts solar energy directly into unchanged
electricity and is now widely used as an alternative source of energy for telecommunications facilities.
Depending on number of photovoltaic converters in solar panels, they can produce unchanged currents
of varying voltage and power, and may vary in size.
3.2.2. Controller device units (Arduino UNO/MEGA)
The Arduino Uno and Arduino MEGA board are taken as CDU. The Arduino Uno was used to
measure parameters of solar power supply from control unit and transfer it to central control unit.
Arduino Uno is a board, that is based on an open source microcontroller ATmega328P (fig. 4.a) [1,4].
3.2.3. Wireless network module (ZigBee/Xbee)
ZigBee is a standard for high-level wireless communication protocols that support small, low-
power digital transmitters based on IEEE 802.15.4 standard.
3.2.4. Display
Display - The LCD display is used to reflect parameters being monitored. In this researches
used a 128x64 OLED graphical display as experimental model. Its real and Proteus software
environmental view is illustrated in Fig. 6 a, b. This display connects to microcontroller unit through
the I2C interface. This enables efficient use of microcontroller ports [7, 8, 9].
3.2.5. Accumulator battery
A battery is a source of chemical power source, a reusable electrical driving force. Its main
peculiar feature is repetition of internal chemical processes, which allows it to accumulate energy and
apply multiple cycles (via charge-recharge) for autonomous energy supply of various electrical
appliances and equipment [10].
3.2.6. Temperature and Humidity Sensor
The DHT22 series sensor was used to measure temperature and humidity of area, where solar
panel installed (Fig. 8). The DHT22 sensor is a well-established electronic temperature and humidity
sensor that connects of microcontroller and DHT22 sensor, through a single data-exchange tire [2, 4].
3.2.7. Current sensor
The AC power sensor as a device used to measure and control alternating current, direct current
and pulse current. Current sensors are widely used in electrical engineering to create contrariwise
communication systems. There are various types of current sensors such as resistive current sensors,
current transformers, and Hall effect sensors. Hall effect sensors can measure and control DC current,
AC current, and pulse current. In addition, they have reliable electrical insulation, stand out with a
wide range of frequencies, and do not emit heat [5, 7, 10, 16].
3.2.8. Voltage sensor
The voltage sensor is a module, that measures voltage in electrical nets. There are several
types: voltage sensors of transformers, resistors, capacitors and other types. The most common type of
voltage sensor is made with two resistors. It has a very simple structure. The two resistors are
connected consecutively and their loose ends are connected to power supply nets. At the same time, a
high voltage is distributed over these resistors. As a result, a voltage of less than 5V , generated on
point, in which two resistors connected [5, 7, 10, 16].
3.2.9. Light sensor
The light sensor is a device for measuring of level of ambient light. In the model, light sensors
are used to monitor of degree of illumination of telecommunications facilities in area, where solar
energy sources are located, to determine whether, the sun is sunny or cloudy and whether area's
illumination is sufficient for energy production. The range of light sensors is formed at different
intervals (luxe). They can be adjusted depending on location and conditions of installation [2, 4, 6].
3.2.10. Dusting sensor

CHEMICAL TECHNOLOGY. CONTROL AND MANAGEMENT. №3 / 2020
24
The dust sensor can measure the dust value by transmitting a signal of 4… 20 mA, or report,
that dust level exceeds aset values. Many dust sensors operate on principle of quantum particle
measurement and detect high-resolution particles larger, than one micron. These particles include
cigarette smoke, household dust, spores, mold and more. Typically, sensors such as SM-PWM-01C,
GP2Y1010AU0F are used to determine level of dust. These sensors determine a concentration of air in
air by using an optical sensitivity method [8].
3.3. Software Algorithm of the monitoring system of solar power station
Solar power station monitoring system has been modeled in two parts: solar power station
management and its measurement system, and monitoring center. They can be viewed as a distributed
system. In other words, these two systems are at a certain distance from each other and have related
and unrelated control processes. Therefore, a separate software was written for each system model in
Arduino IDE environment. Created algorithm illustrated in Fig. 3, as a block diagram [3].
a) b)
Fig. 3. Software algorithm for monitoring system:
a) software algorithm for transmission part,
b) software algorithm for receiving part
Fig. 3.a illustrates solar power station management and its algorithm for measuring software
system. As shown from this algorithm, the signals, coming from sensors located in object are
converted to digital and their values are determined. All defined parameters are displayed in the Serial
Monitor. At the same time, values of parameter are passed through serial ports to XBee wireless nets
module [3].
CONTROL OF TECHNOLOGICAL PARAMETERS
25
Fig. 3.b illustrates the algorithm of management system of the solar power station’s monitoring
center. In this case, after the system is fully loaded, the serial port determines the data flow or byte
sequence (value type - String) from the XBee wireless network module. Then each character in this
information is scanned and the value corresponding to the character is divided by the measured
parameters. Defined parameters are displayed on the Serial Monitor and LCD. At the same time, these
values are transmitted to Web Server using Internet network interfaces.
4. Designed Structures of Monitoring System
The structure of power monitoring system of any facility consists of three parts. These are
measuring part, server part and web page. Specific sensors (such as current, voltage, etc.) are installed
in measurement unit for energy sources and consumer loads. These sensors will be connected to
control unit, which is a small computing system.
The sensors detect changes in object and transmit signal to control unit as voltage or current.
The control unit converts to voltage or current signal into digital form and transmits it via wireless nets
to central control unit (or Monitoring Center). There may be more than one such as system. The
information transferred from them is consolidated in central control unit (Monitoring Center) and
transmitted via Internet to server. At the same time, it is possible to monitor real-time values from
sensors using a web browser [2, 4, 17].
The process of designing remote monitoring of solar power sources of telecommunications
facilities in Proteus software environment was carried out in three stages:
- Equipping the solar power station with sensors and IoT technology;
- Equipping the monitoring center with IoT technology
- Creating a website for monitoring.
Typically, this system is designed to remotely monitor solar power stations located in different
areas. As an example in this experiment implemented a monitoring system for only one solar power
plant in a virtual environment. But proposed idea can be used during monitoring of all power plants in
designated area. There may be used more than 100 such as solar power stations.
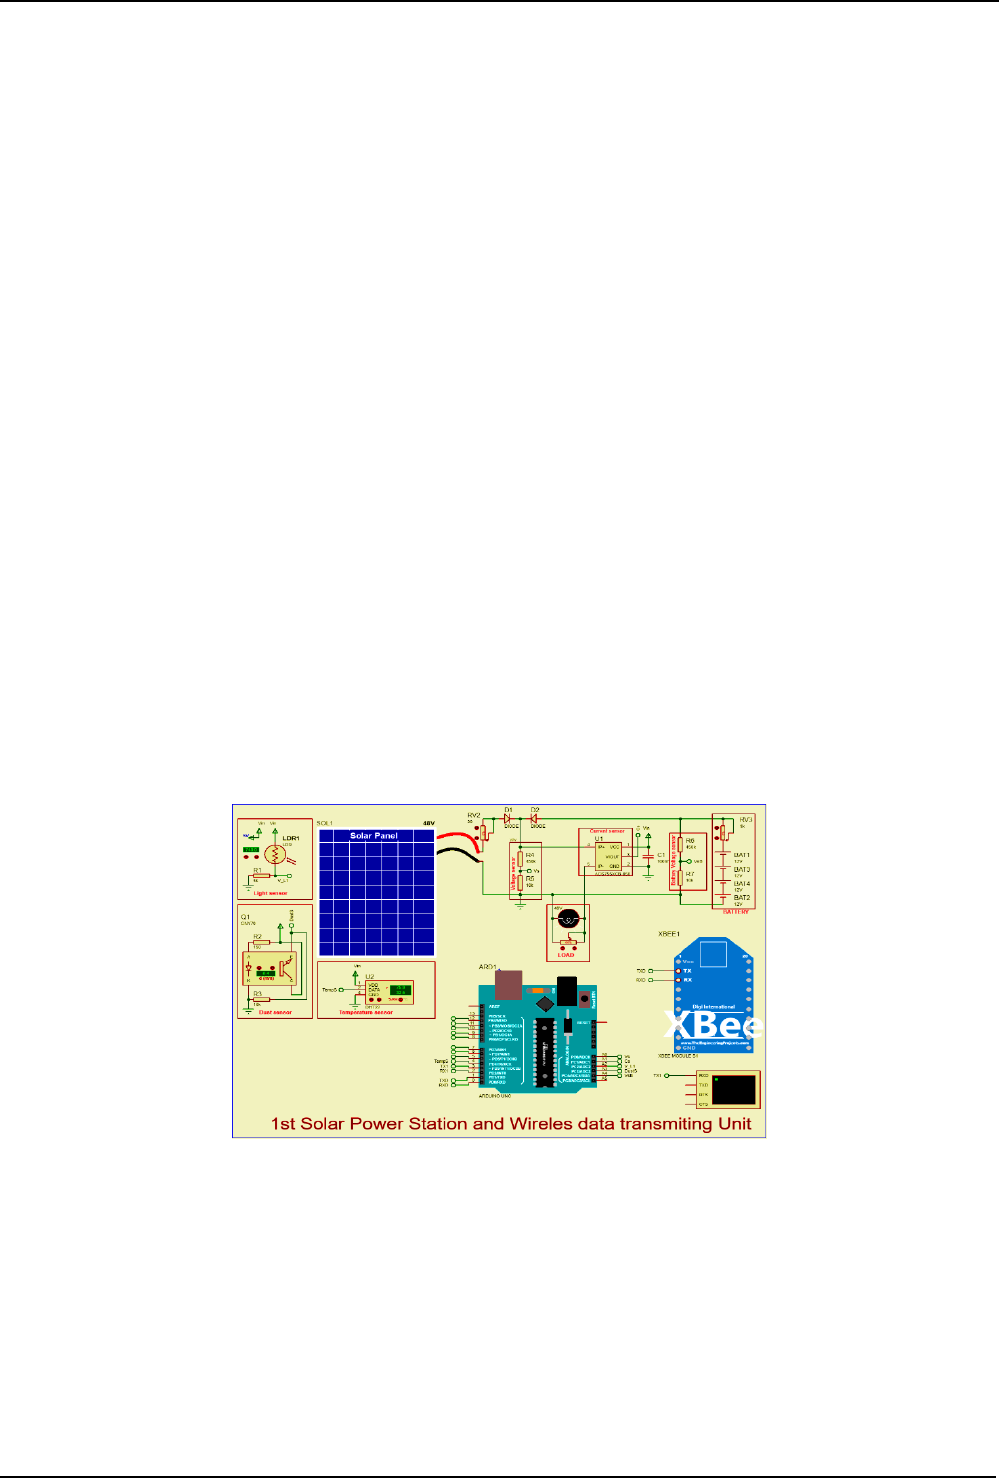
Fig. 4. Solar power plant equipped on the basis of IoT technology.
Fig. 4 shown first step of power system, designed in proposed virtual environment. Several
sensors are used for area, where solar panels are located and telecommunications facilities: light
sensors, dust sensors, temperature and humidity sensors, voltage sensors, and current sensors. The
characteristics of these sensors are mentioned above. They usually serve to determine condition of
solar panel's, installed location (such as the temperature of the solar panel, dusting the surface, air
humidity), the amount of energy the solar panel produces, amount of battery charge and energy
consumed by telecommunications facilities. Defined parameters are transmitted to monitoring center
using ZigBee/Xbee wireless nets modules [5, 7, 10, 14].
CHEMICAL TECHNOLOGY. CONTROL AND MANAGEMENT. №3 / 2020
26
In next section, Monitoring Center is designed to monitor and analyze parameters measured at
solar power plants (Fig. 5). The monitoring center is equipped with Arduino MEGA, virtual terminal,
ZigBee/Xbee wireless network module, LCD display, as well as Internet network module (may include
YUN WiFi & Ethernet module, as well as GSM, Ethernet, WiFi). The monitoring center receives the
parameters measured and transmitted at solar power plant using ZigBee / Xbee wireless nets module.
The received data is displayed using a virtual terminal and LCD display. Simultaneously, these
parameters are passed to webserver. The measured parameters are stored in webserver memory.
Fig. 5. Monitoring center equipped on IoT technologies.
It is well known, that the monitoring system requires a system of remote control, management
and evaluation of distributed system parameters to stay at a discretionary distance. A simple web page
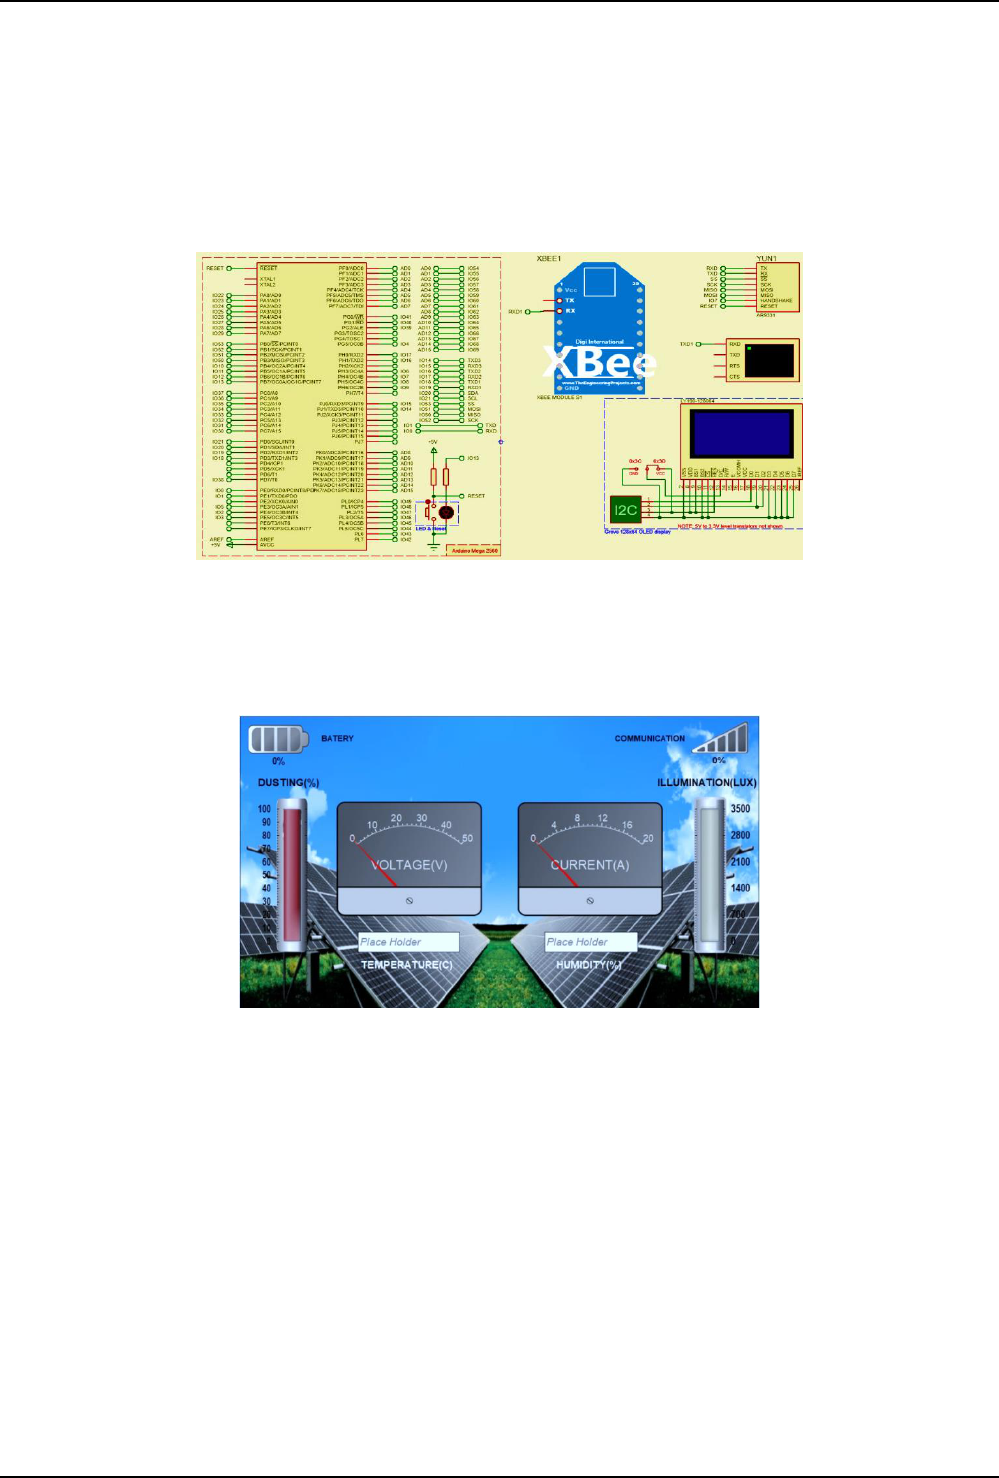
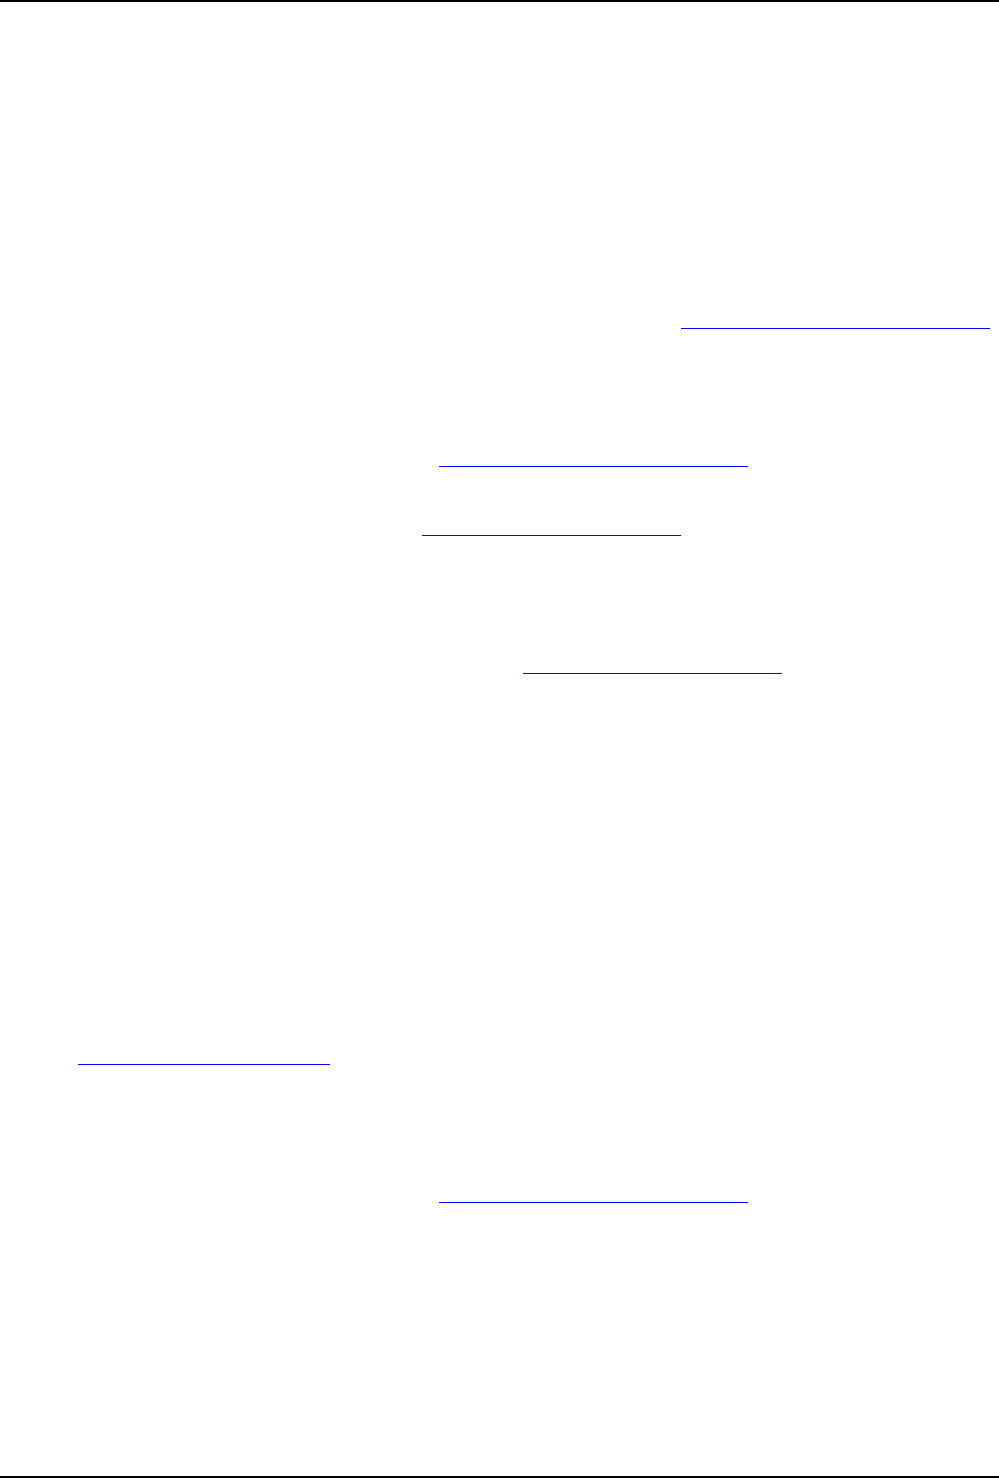
was created to fulfill the tasks set out in third stage of monitoring system modeling (Fig. 6).
Fig. 6. Web page view of monitoring system.
The webpage can be referenced by typing a web address in any web browser. As a result, a web
browser display page shown in Fig. 6. On this page, values of solar power plants' measured parameters
(solar panel dusting, voltage, current, battery charge, ambient light, temperature, humidity) are
presented in various graphical images and figures. Watching every change in the real-time organize in
shown webpage. This allows us to monitor system performance, to quickly identify problems, and to
use optimal solutions to address it, to evaluate and improve system's performance.
5. Results
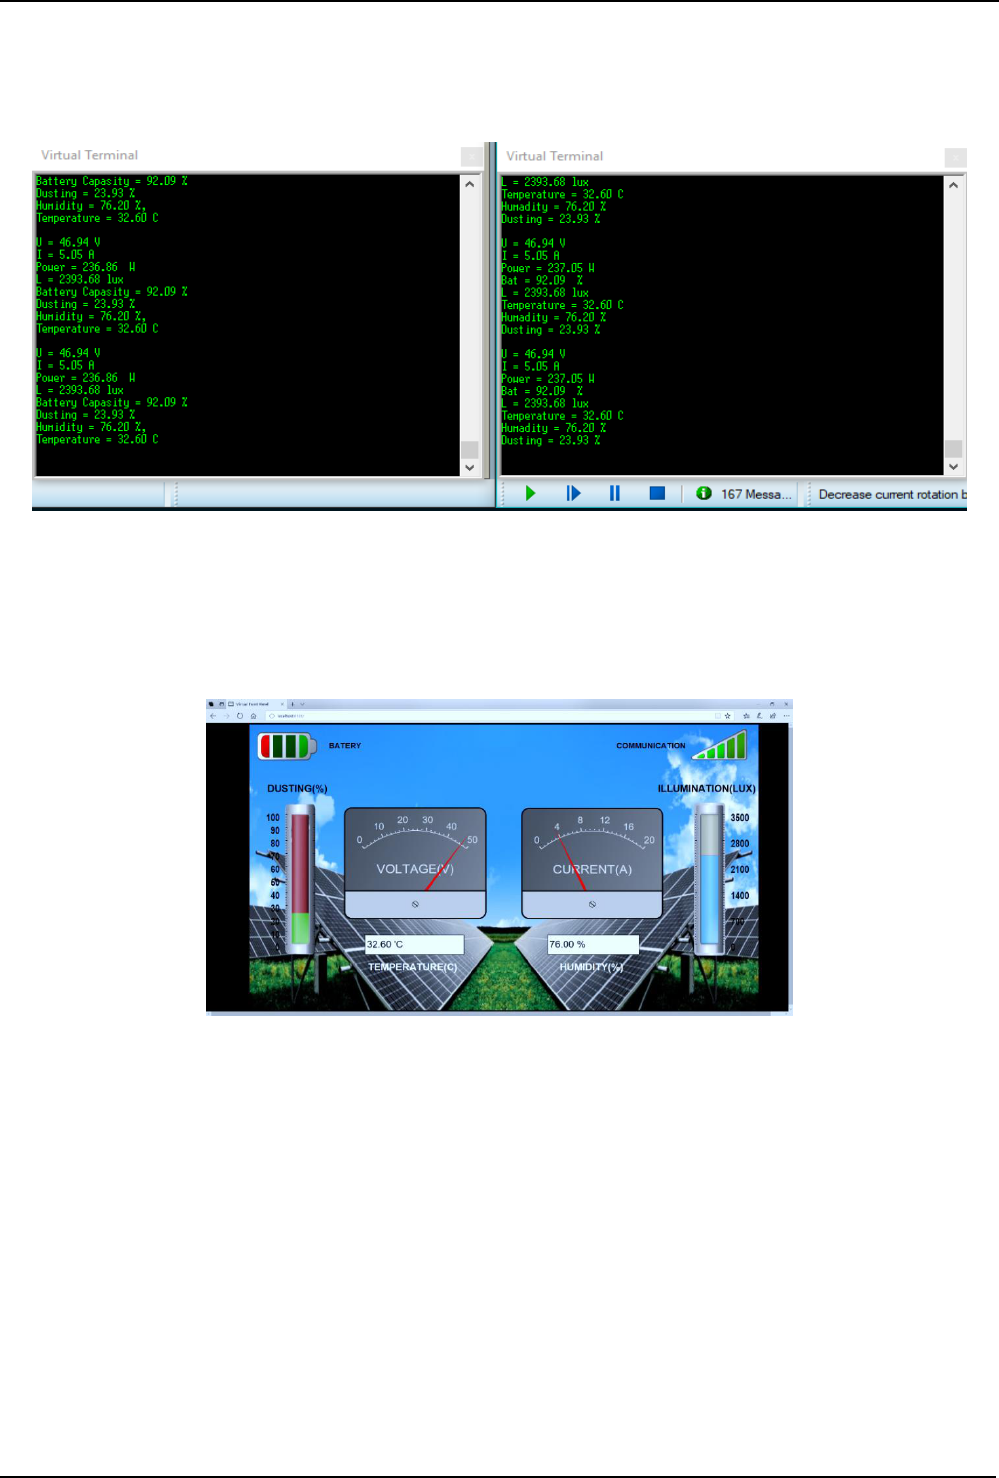
As a results of system modeling of simulation process, were usually analyzed use Virtual
Terminal and Digital Oscilloscope. The Virtual Terminal and Digital Oscilloscope are connected to
signal channels transmitted by the solar power station to Xbee nets module and received through Xbee
nets module, located in monitoring center, as well as Internet wireless interface (YUN WiFi &
Ethernet). The initial cheeked performed for transmitted and received signals, and a result is illustrated
CONTROL OF TECHNOLOGICAL PARAMETERS
27
in fig. 7.a and fig. 7.b. Fig. 7.a, belongs to transmitting values and Fig. 7.b belongs to the receiving
values. In shown figures, values of transmitted by solar power station and received by monitoring
center are same. This means, that measured values are passed and received through Xbee nets of
module, navn’t any errors.
a) b)
Fig. 7. The view window of values, transmitted and received by Xbee nets module, during simulation in Virtual
Terminal.
As shown from simulation results of solar power station of telecommunications facilities,
monitoring system model in any web browser may be installed on PCs or smartphones.
Fig. 8. Web page view of solar power station monitoring system.
The result of simulated system was verified by using a Microsoft Edge web browser installed
on the PC (fig. 6). For view of results, first need open a web browser. Then enter “localhost: 8181”. As
a result, the web page shown in Fig. 8 will be open. On the basis of created web page, researched
system status can be monitored in real time.
6. Conclusion
Today, the increasing demand for renewable energy sources led to development of research and
to improve their efficiency of such systems and to use it in various facilities. In particular, use of solar
power station for telecommunications facilities is a key factor in energy conservation processes.
Therefore, design of this system was developed and modeled. Mainly factors of this research is that,
software product for this system has been modern created . There was research on all parameters of
solar power station. On the basis of nasalizing of results, can be watching, that, these settings
CHEMICAL TECHNOLOGY. CONTROL AND MANAGEMENT. №3 / 2020
28
parameters and values may be changed by monitoring center and webpage settings. In this case, when
optional parameters of the solar power station were changed, monitoring center and web site were
updated at the same time. Value has been changed to replace the previous one. This moments of
fresearch is a key determining factor for accurate and reliable operation of the power control and
monitoring system.
References:
1. D.A.Davronbekov, “Features Measurement Parameters and Control Functioning of Integrated Chips”, International
Conference on Information Science and Communications Technologies, ICISCT 2016.
2. Kh.E.Khujamatov, D.T.Khasanov, E.N.Reypnazarov, “Research and Modelling Adaptive Management of Hybrid
Power Supply Systems for Object Telecommunications based on IoT”, International Conference on Information
Science and Communications Technologies ICISCT 2019, Tashkent, 2019. DOI: 10.1109/ICISCT47635.2019.9011831.
3. R.Nagalakshmi, B.Kishore Babu, D.Prashanth, “Design and Development of a Remote Monitoring and Maintenance of
Solar Plant Supervisory System”, International Journal Of Engineering And Computer Science, vol. 3, Issue 12,
December, 2014.
4. Kh.E.Khujamatov, D.T.Khasanov, E.N.Reypnazarov, “Modeling and Research of Automatic Sun Tracking System on
the bases of IoT and Arduino UNO”, International Conference on Information Science and Communications
Technologies ICISCT 2019, Tashkent, 2019. DOI: 10.1109/ICISCT47635.2019.9011913.
5. I.Kh.Siddikov, Kh.A.Sattarov, Kh.E.Khujamatov, O.R.Dekhkonov, “Modeling the processes in magnetic circuits of
electromagnetic transdusers”, International Conference on Information Science and Communications Technologies
ICISCT 2016, November, Tashkent, 2016. DOI: 10.1109/ICISCT.2016.7777393.
6. Abhishek Parikh, Farah Pathan, Bhavdipsinh Rathod, Sandeep Shah. “Solar Panel Condition Monitoring System based
on Wireless Sensor Network”, International Journal of Science, Engineering and Technology Research, vol. 4, Issue
12, December, 2015.
7. I.Kh.Siddikov, Kh.A.Sattarov, Kh.E.Khujamatov, “Modeling of the Transformation Elements of Power Sources
Control”, International Conference on Information Science and Communications Technologies (ICISCT) Applications,
Trends and Opportunities, November, Tashkent, 2017. DOI: 10.1109/ICISCT.2017.8188581.
8. S.Madhubala, R.Nachammai, I.Nandhini, A.M.Preethisha, J.Janet Paulin, “Solar power based remote monitoring and
control of industrial parameters using IoT”, International Research Journal of Engineering and Technology, vol. 05,
Issue 03, 2018.
9. S.P.Vijayaragavan, B.Karthik, M.Sriram, “Wind Mill Monitoring System using IOT and WI-FI”, International Journal
of Recent Technology and Engineering, vol. 8, Issue 1, 2019.
10. D.Davronbekov, U.T.Aliev, J.D.Isroilov, “Using the energy of electromagnetic radiation as a source of power”,
International Conference on Information Science and Communications Technologies, ICISCT 2017, pp. 1-3.
11. M.Farzhana Parveen, R.Neelavathy, S.B.Reshma, U.Saravanakumar, “Simulation, Fabrication and Monitoring of a
Solar Power Plants using Arm7 and Proteus Software”, International Journal of Engineering Science and Computing,
vol. 9, no. 5, 2019.
12. D.A.Davronbekov, U.T.Aliev, J.D.Isroilov, X.F.Alimdjanov, “Power Providing Methods for Wireless Sensors”,
International Conference on Information Science and Communications Technologies. Applications, Trends and
Opportunities, ICISCT 2019.
13. I.Kh.Siddikov, Kh.A.Sattarov, Kh.E.Khujamatov, O.R.Dexkhonov, M.R.Agzamova, “Modeling of Magnet Circuits of
Electromagnetic Transducers of the Three-Phases Current”, XIV International Scientific-Technical Conference on
Actual Problems of Electronics Instrument Engineering (APEIE-2018), October 2-6, Novosibirsk, 2018, pp. 419-422,
DOI: 10.1109/APEIE.2018.8545714.
14. U.K.Matyokubov, D.A.Davronbekov, “The Impact of Mobile Communication Power Supply Systems on
Communication Reliability and Viability and Their Solutions”, International Journal of Advanced Science and
Technology, vol. 29, no. 5, pp. 3374 – 3385, 2020.
15. A.A.Muradova, Kh.E.Khujamatov, “Results of Calculations of Parameters of Reliability of Restored Devices of the
Multiservice Communication Network”, International Conference on Information Science and Communications
Technologies ICISCT 2019, Tashkent, 2019. DOI: 10.1109/ICISCT47635.2019.9011932.
16. I.Kh.Siddikov, Kh.A.Sattarov, Kh.E.Khujamatov, “Research of the Influence of Nonlinear Primary Magnetization
Curves of Magnetic Circuits of Electromagnetic Transducers of the Three-phases Current”, Universal Journal of
Electrical and Electronic Engineering. Horizon Research Publishing Corporation, vol. 4(1), pp. 29 – 32, 2016, DOI:
10.13189/ujeee.2016.040104.
17. I.Kh.Siddikov, Kh.A.Sattarov, Kh.E.Khujamatov, “Modeling and research circuits of intelligent sensors and
measurement systems with distributed parameters and values”, Chemical technology control and management, vol. 4-5,
pp. 50-55, 2018.
