
DATA ANALYSIS PLAN
1. How it fits in
2. What it shows
3. Example
4. Tips and morals
Henry Feldman
Clinical Research Center
Boston Children’s Hospita
l
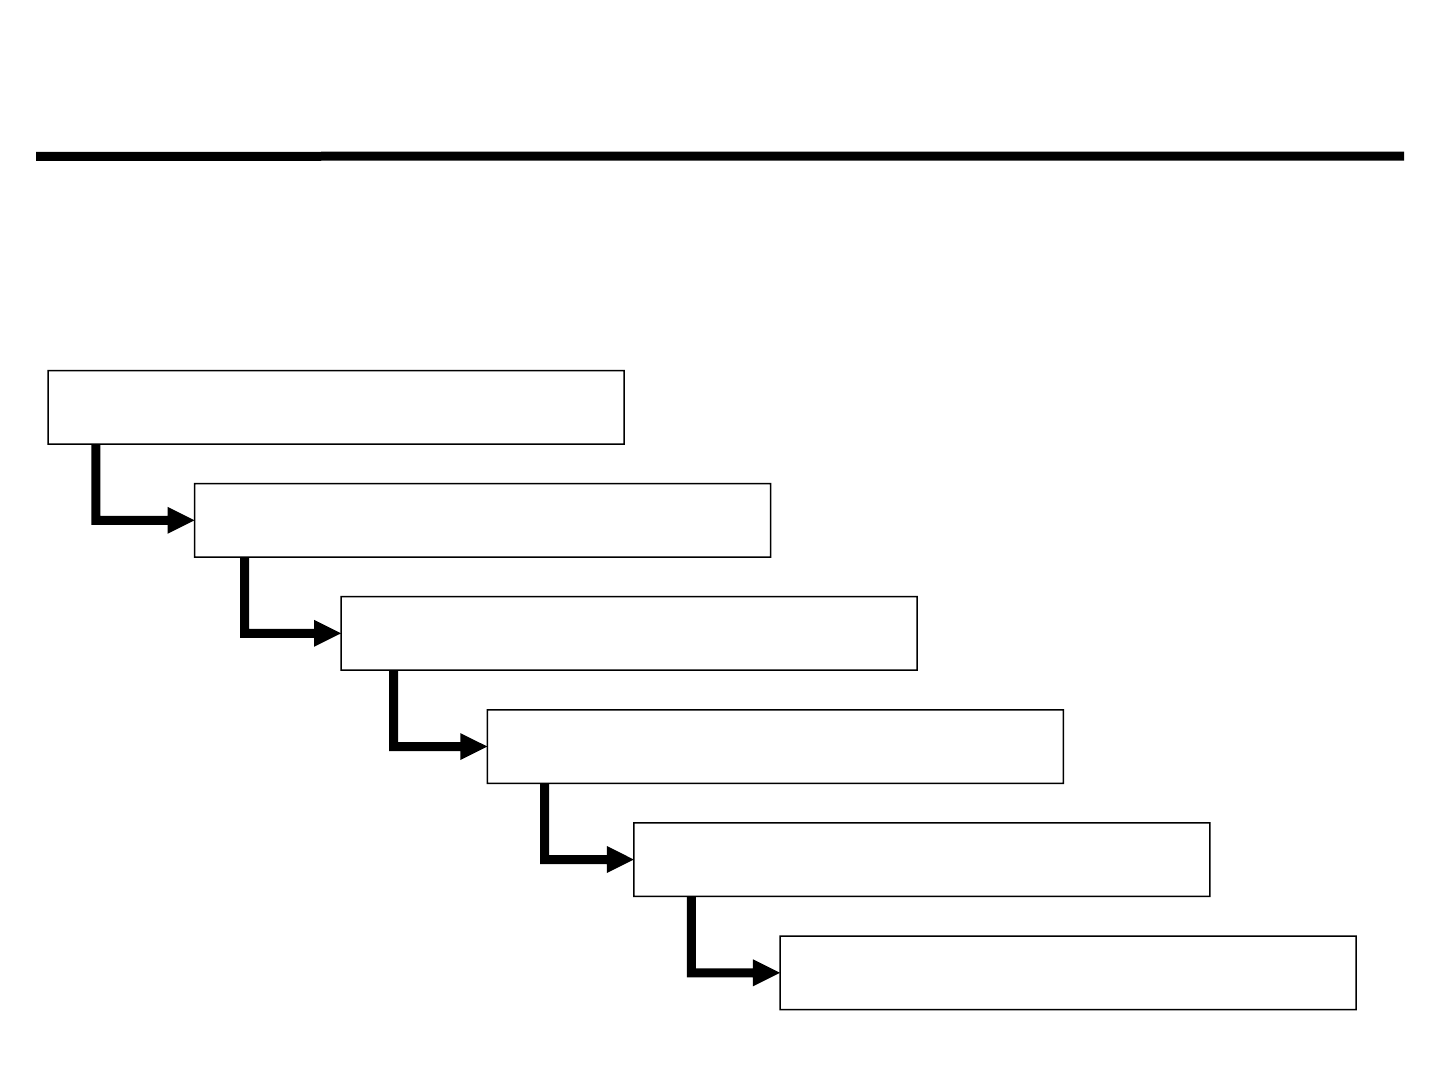
analysis plan: bird’s-eye view
A good analysis plan is the ultimate demonstration
that your whole proposal is well formulated.
Specific Aims
Hypotheses
Study Design
Data Collection
Analysis Plan
Power

what the analysis plan shows
You know what data you will collect.
• Outcomes: single, composite, I
o
, II
o
, exploratory
• Independent variables: groups, exposures, predictors
• Covariates, confounders, mediators, modifiers
• Correlated clusters
You thought about how the data will come out.
• Yes/no data: how to classify
• Measured data: source and magnitude of variance
• Missing data

what the analysis plan shows cont.
You thought about how to analyze the data.
• Address hypotheses and aims
• Account for covariates, confounders, clusters
• Test interactions
• Express the design, do justice to the data
• Template useful at abstract and manuscript time
• NOT the Table of Contents of your biostatistics text

what the analysis plan shows cont.
You assessed chances of an interesting finding.
• Choice of sample size, what it gets you
• Precision for descriptive aims
• Power to detect clinically significant effect, if it’s there
• Minimum interesting difference
You have the resources to carry out your plan.
• Software and hardware
• Consultants and collaborators

analysis plan: example
• The primary endpoint is free testosterone level, measured at
baseline and after the diet intervention (6 mo).
• We expect the distribution of free T levels to be skewed and will log-
transform the data for analysis. Values below the detectable limit for
the assay will be imputed with one-half the limit.
• The primary analysis will be a comparison of 6-mo changes in free T
between the two diet arms, using Student’s independent t-test with
two-sided p<0.05 as critical value.
• We will follow the intention-to-treat principle, analyzing each subject
as randomly assigned regardless of compliance with diet.
• In secondary analyses we will use multiple regression to adjust for
covariates including age, pubertal stage, insulin responsiveness.
• We will test for interactions, particularly for modification of the diet
effect on free T by pubertal stage and insulin responsiveness.

analysis plan: example cont.
• Comparison of dichotomous outcomes (rash, nausea) will be made
by Fisher exact test, then by logistic regression to adjust for
covariates and test interactions.
• To test for biased dropout, we will compare baseline characteristics
of those who completed to those who dropped out.
• SAS software version 9.3 will be used for all computations.
• The magnitude of detectable diet effect depends on (a) coefficient of
variation of free T, estimated to be 2.3% inter-assay and 40% inter-
subject [18]; (b) within-subject correlation, estimated at 0.6 [26].
• The planned sample of 30 provides 80% power to detect a 20-50%
differential in free T change between diets.
• Literature suggests that this diet can produce such an effect, and
any smaller effect would not be clinically significant.

• Data are random numbers. Plan accordingly.
• Statistical analysis is the language of scientific
inference. Expand your vocabulary.
• Statistical analysis is harder than it looks.
• Get help now, before you start writing.
• Get help while you are writing.
• Budget help for later.
• When in doubt, call statistician.
• When not in doubt, call statistician.
analysis plan: TIPS & MORALS
