
2022 COUNTY-LEVEL ECONOMIC FORECAST
San Luis Obispo County Economic Forecast
1 |
Forecast Summary
• The rapid restoration of 4,800 non-farm jobs in San Luis Obispo
County during 2021 represented almost half of the jobs that were
lost in 2020. Another 4,200 jobs will be restored in 2022.
• Employment gains in 2022 will be largest in leisure services,
which will gain 1,700 jobs. Another 900 jobs will be added in
private education and healthcare. Together, they will account for
60 percent of all jobs created.
• Leisure and hospitality job creation has benetted from the surge
in California coastal tourism in 2021 and 2022. A larger volume
of travelers to Pismo Beach, Paso Robles, and the City of San
Luis Obispo has largely restored jobs at restaurants and hotels.
• The unemployment rate averaged 5.3 percent in 2021. It is
forecast to average 2.7 percent in 2022.
• The San Luis Obispo County population will continue to contract
in 2022 and 2023 and increase modestly in 2024.
• Housing production has increased sharply in 2022, and will remain
prolic in 2023 and 2024 with a focus on single-family homes. A
number of large housing projects are currently under construction
in the City of San Luis Obispo.
• Home prices increased 16 percent in 2021. The median price
is expected to increase by 7 to 8 percent in 2022. The median
selling value is now north of $850,000.
• Diablo Canyon Nuclear Power plant, the largest private employer
in the county will continue operating until 2030 instead of closing
by 2025 as originally planned.
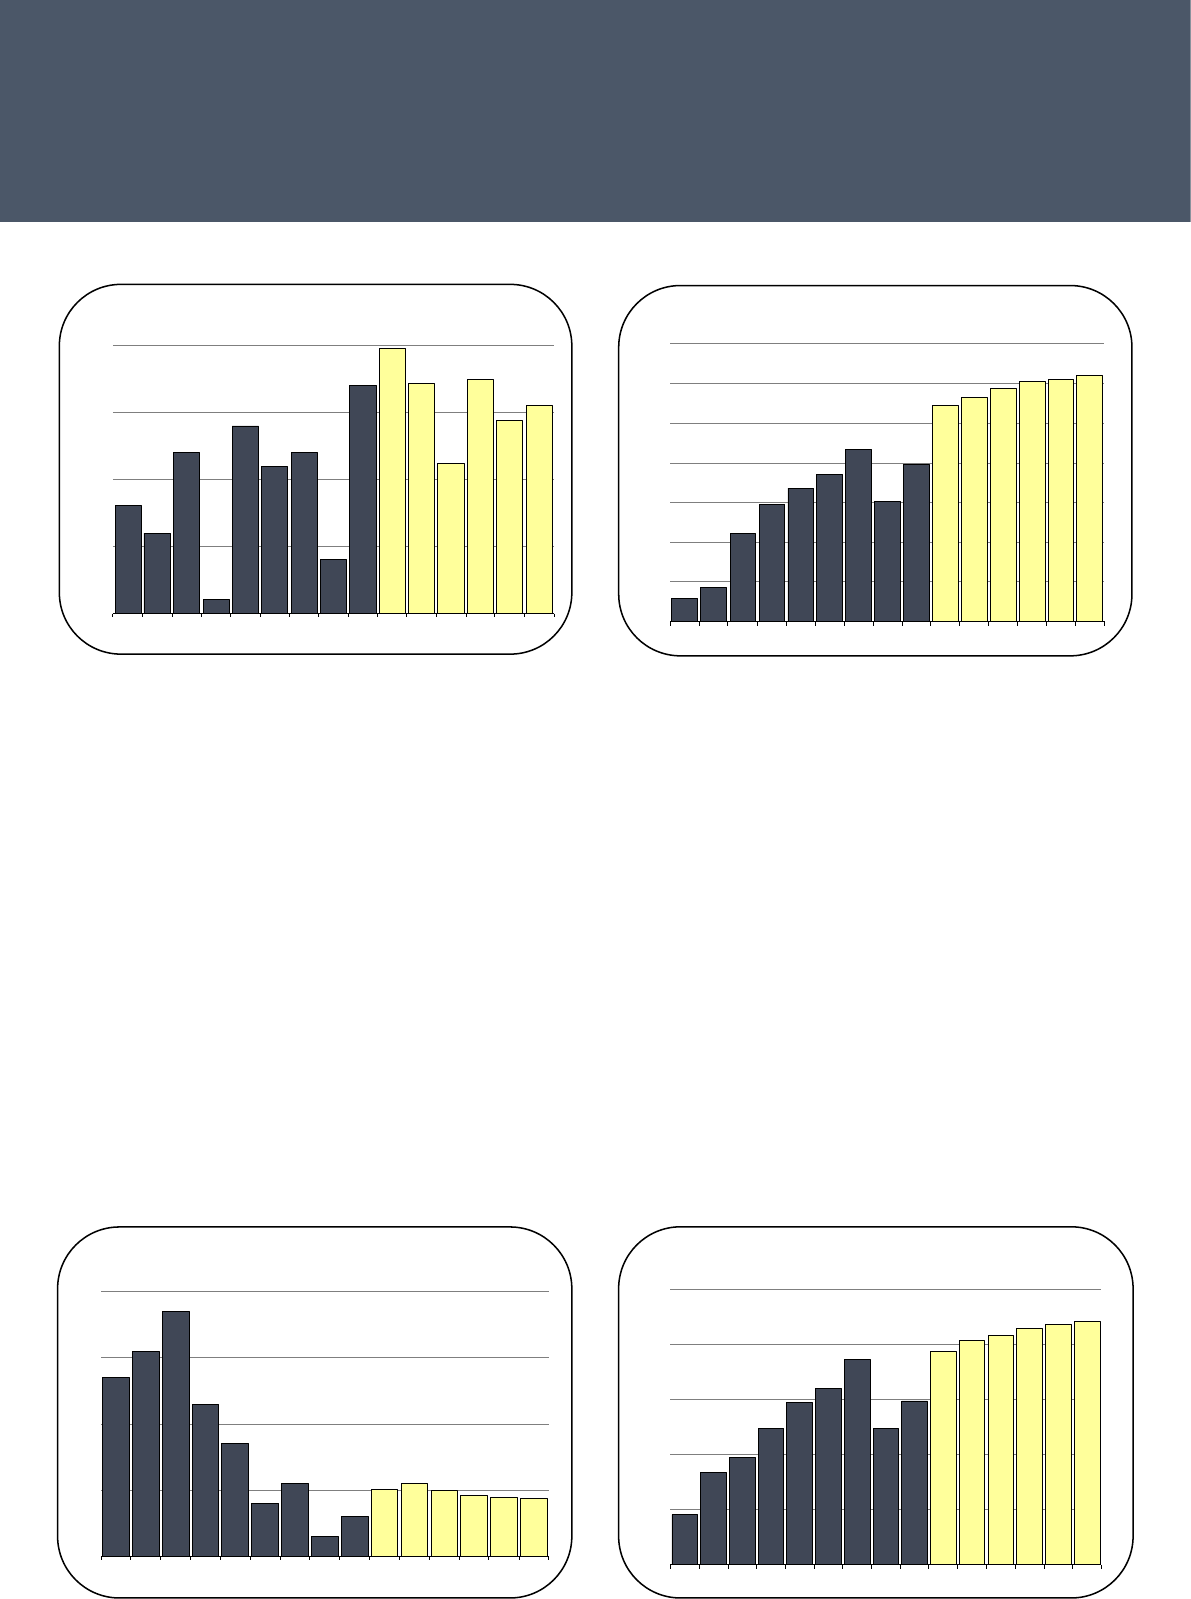
Job Growth
• Total employment in San Luis Obispo County will rise 3.7 percent
in 2022, and 1.7 percent in 2023.
• Between 2022 and 2027, job growth will average 1.4 percent
per year.
Construction Employment
• The number of homes under construction is on pace to eclipse
1,200 units in 2022. The number of approved projects in the City
of San Luis Obispo include more than 2,000 homes, and nearly
3,000 in the total residential pipeline.
• The expected level of both housing production and non-residential
construction activity will not require a large expansion of the
construction workforce. The forecast calls for restrained growth
of construction due in part to labor force availability.
-1.8
-1.2
-0.6
0.0
0.6
1.2
2013 2015 2017 2019 2021 2023 2025 2027
Population Growth
2013 - 2027
percent
San Luis Obispo
County
Central Coast
forecast
-9
-6
-3
0
3
2013 2015 2017 2019 2021 2023 2025 2027
Non-farm Job Growth
percent
2013 - 2027
6
San Luis Obispo
County
Central Coast
forecast
5
6
7
8
9
10
2013 2015 2017 2019 2021 2023 2025 2027
Construction Employment
2013 - 2027
jobs (000s)

2022 COUNTY-LEVEL ECONOMIC FORECAST
San Luis Obispo County Economic Forecast
2 |
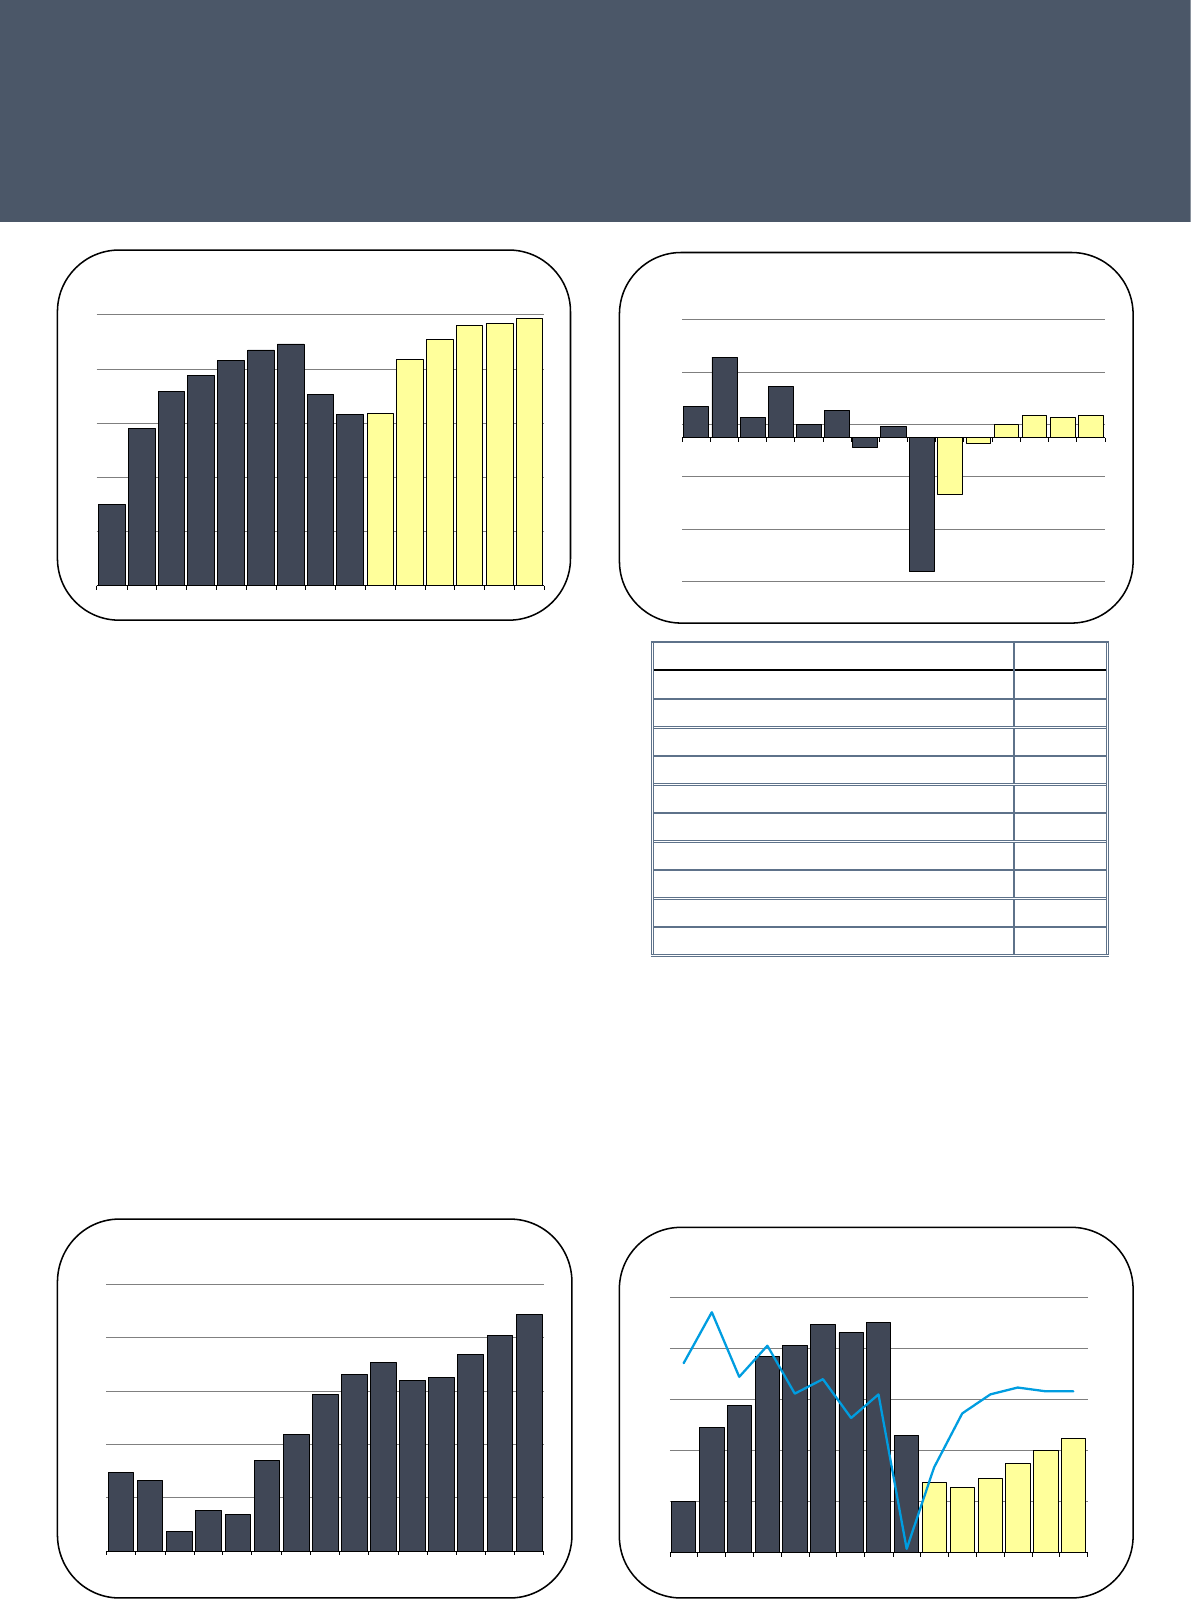
Transportation, Warehousing, Utilities Employment
• Jobs in this industry are principally associated with the airport,
logistics where rms deliver goods to and from local businesses,
and the public utilities. The pandemic recession impacted
transportation jobs but not logistics or utility sector jobs.
• Diablo Canyon Nuclear Power Plant employs approximately 1,100
workers and is the largest private employer in the county. The plant
was destined for closure by 2025 until the state passed legislation
in September 2022 to extend full capacity operation until 2030.
• The reprieve to closing continues until November 2030, when
Diablo Canyon Nuclear Power Plant will be decommissioned, a
process that will last up to 10 years.
• Closing the plant will have negative impacts on the county’s
economy, especially the labor market. This impact however will
likely be gradual over time.
Retail Trade Employment
• The jobs forecast for retail trade is positive in 2022, 2023 and
2024 due largely to the growth of wine tourism and new housing
in the county which includes retail development.
• Over the longer term, automation and the transition to online
shopping will reduce the existing retail workforce.
Diablo Canyon Nuclear Power Plant
3.6
3.7
3.8
3.9
4.0
4.1
4.2
2013 2015 2017 2019 2021 2023 2025 2027
Transportation, Warehousing, Utilities Employment
2013 - 2027
jobs (000s)
12.7
13.0
13.3
13.6
13.9
14.2
14.5
2013 2015 2017 2019 2021 2023 2025 2027
Retail Employment
2013 - 2027
jobs (000s)
2022 COUNTY-LEVEL ECONOMIC FORECAST
San Luis Obispo County Economic Forecast
3 |
Financial Activities Employment
• The San Luis Obispo County nancial activities sector is primarily
comprised of real estate agencies, insurance rms, and banks.
• Over the forecast period, job growth will be observed in the real
estate management, leasing, and brokerage. Banks, mortgage
lenders, and insurance rms will create very few jobs between
2022 and 2027, and may lose jobs over the long term.
Professional and Business Services Employment
• The sector includes law rms, accounting, engineering, tech and
scientic consulting services, and marketing.
• Professional services jobs were largely restored in 2021. In 2022,
this sector is one of the principal creators of jobs with an estimated
650 positions being lled.
• Over the forecast, new jobs will be created in the business
consulting, IT consulting, and building maintenance subsectors.
Information Employment
• In San Luis Obispo County, the information sector is dominated
by software rms, traditional print publishers, movie theaters, and
telecommunications companies like Comcast.
• Mindbody is the most prominent software publisher in San Luis
Obispo County. Mindbody had a peak of 1,337 employees in 2016
but major layoffs occurred during the pandemic. It is estimated
that the company now employs 929.
Private Education and Healthcare Employment
• Job gains in healthcare totaled 500 in 2021 and will exceed 900
in 2022.
3,750
3,800
3,850
3,900
3,950
2013 2015 2017 2019 2021 2023 2025 2027
Financial Activities Employment
2013 - 2027
jobs
9.0
9.5
10.0
10.5
11.0
11.5
12.0
12.5
2013 2015 2017 2019 2021 2023 2025 2027
Professional & Business Employment
2013 - 2027
jobs (000s)
14.5
15.5
16.5
17.5
18.5
19.5
2013 2015 2017 2019 2021 2023 2025 2027
Education & Healthcare Employment
2013 - 2027
jobs (000s)
1.1
1.2
1.3
1.4
1.5
2013 2015 2017 2019 2021 2023 2025 2027
Information Employment
2013 - 2027
jobs (000s)

2022 COUNTY-LEVEL ECONOMIC FORECAST
San Luis Obispo County Economic Forecast
4 |
• Because the county has a particularly older population, the
demand for healthcare will continue to generate the need for
rising employment over the forecast. Between 2022 and 2027,
the total workforce is forecast to increase by nearly 1,500 jobs.
15
16
17
18
19
20
21
22
2013 2015 2017 2019 2021 2023 2025 2027
Leisure & Hospitality Employment
2013 - 2027
jobs (000s)
15
25
35
45
55
65
75
85
Apr-19 Sep-19 Feb-20 Jul-20 Dec-20 May-21 Oct-21 Mar-22 Aug-22
Hotel Occupancy Rate
April 2019 - August 2022
percent of
rooms occupied
Hearst Castle in San Simeon was the estate of William Randolph Hearst from 1919 to 1947. It is
now owed by the State of California. The residence has 165 rooms lled with rare Egyptian and
European antiques and artwork collected by Hearst during his lifetime. The Castle had 860,000
visitors during 2019 but was closed during the pandemic, re-opening on May 11, 2022.
Leisure and Hospitality Employment
• Just over 2,000 jobs were restored in the Leisure and Hospitality
sector during 2021. Another 1,700 jobs will be reinstated during
2022. A full recovery is forecast in early 2023.
• Utilization rates at the county’s hotels and motels recovered in the
summer of 2021. With a surge in California tourism including wine
tourism during 2022, visitor counts are rising to record levels in
many parts of California, including San Luis Obispo County. More
hotels have recently been constructed or are now underway in
the County, notably within the City of San Luis Obispo.
• The principal attractions are Lake Nacimiento, the Paso Robles
wine country, Edna Valley wineries, the coastal cities of Pismo
Beach, Avila Beach, Moro Beach and Cambria, and Hearst Castle.
2022 COUNTY-LEVEL ECONOMIC FORECAST
San Luis Obispo County Economic Forecast
5 |
Government Employment
• Public sector employment is the largest labor market in San
Luis Obispo County representing 19 percent of total non-farm
employment. The public sector includes the K-12 schools, Cuesta
College, Cal Poly SLO, Atascadero State Hospital, and the California
Men’s Colony.
• The West Facility of the California Men’s Colony, which houses
medium and minimum-security inmates, will be closed in 2023.
Prison jobs will be transferred to alternative facilities.
• Employment declined within state and local government
departments by 400 jobs in 2021 and is on pace to contract by
700 positions in 2022.
• Enrollment at Cal Poly SLO is still expanding. The total student
headcount as of Fall 2022 is now at 22,400; a record high.
Population Growth
• Population declined in 2021 due to a surge of estimated out-
migration. Net out-migration is forecast to continue in 2022 and
2023 due principally to affordability issues with housing.
-1.6
-1.2
-0.8
-0.4
0.0
0.4
0.8
1.2
274
276
278
280
282
284
2013 2015 2017 2019 2021 2023 2025 2027
Population & Population Growth Rate
2013 - 2027
population
(thousands)
growth
rate (%)
Growth Rate
-4,400
-2,800
-1,200
400
2,000
3,600
2013 2015 2017 2019 2021 2023 2025 2027
Net Migration
2013 - 2027
inmigrants
minus
outmigrants
20
21
22
23
24
25
2013 2015 2017 2019 2021 2023 2025 2027
Government Employment
2013 - 2027
jobs (000s)
18
19
20
21
22
23
Fall 2008 Fall 2010 Fall 2012 Fall 2014 Fall 2016 Fall 2018 Fall 2020 Fall 2022
CSU Cal Poly Student Enrollment
Fall 2008 - Fall 2022
thousands
of students
Institution Jobs
Cal Poly State University 3,000
Count
y of San Luis Obispo 2,920
Atascadero State Hospital 2,000
California Men’s Colony 1,517
Lucia Mar Unied Schools 1,000
Paso Robles Public Schools 935
San Luis Unied Schools 760
California Dept of Transportation 541
Cuesta College 500
City of San Luis Obispo 400
Source: San Luis Obispo Chamber of Commerce, State of California Labor Market Information Division
2022 COUNTY-LEVEL ECONOMIC FORECAST
San Luis Obispo County Economic Forecast
6 |
• Positive net in-migration is expected to account for all population
growth in San Luis Obispo County after 2023. Consequently, if
net migration continues to contract beyond 2023, the decline in
the county’s population will be extended.
• The county has one of the highest shares of older residents for
a large county in California. The annual number of deaths will
outnumber births for the foreseeable future.
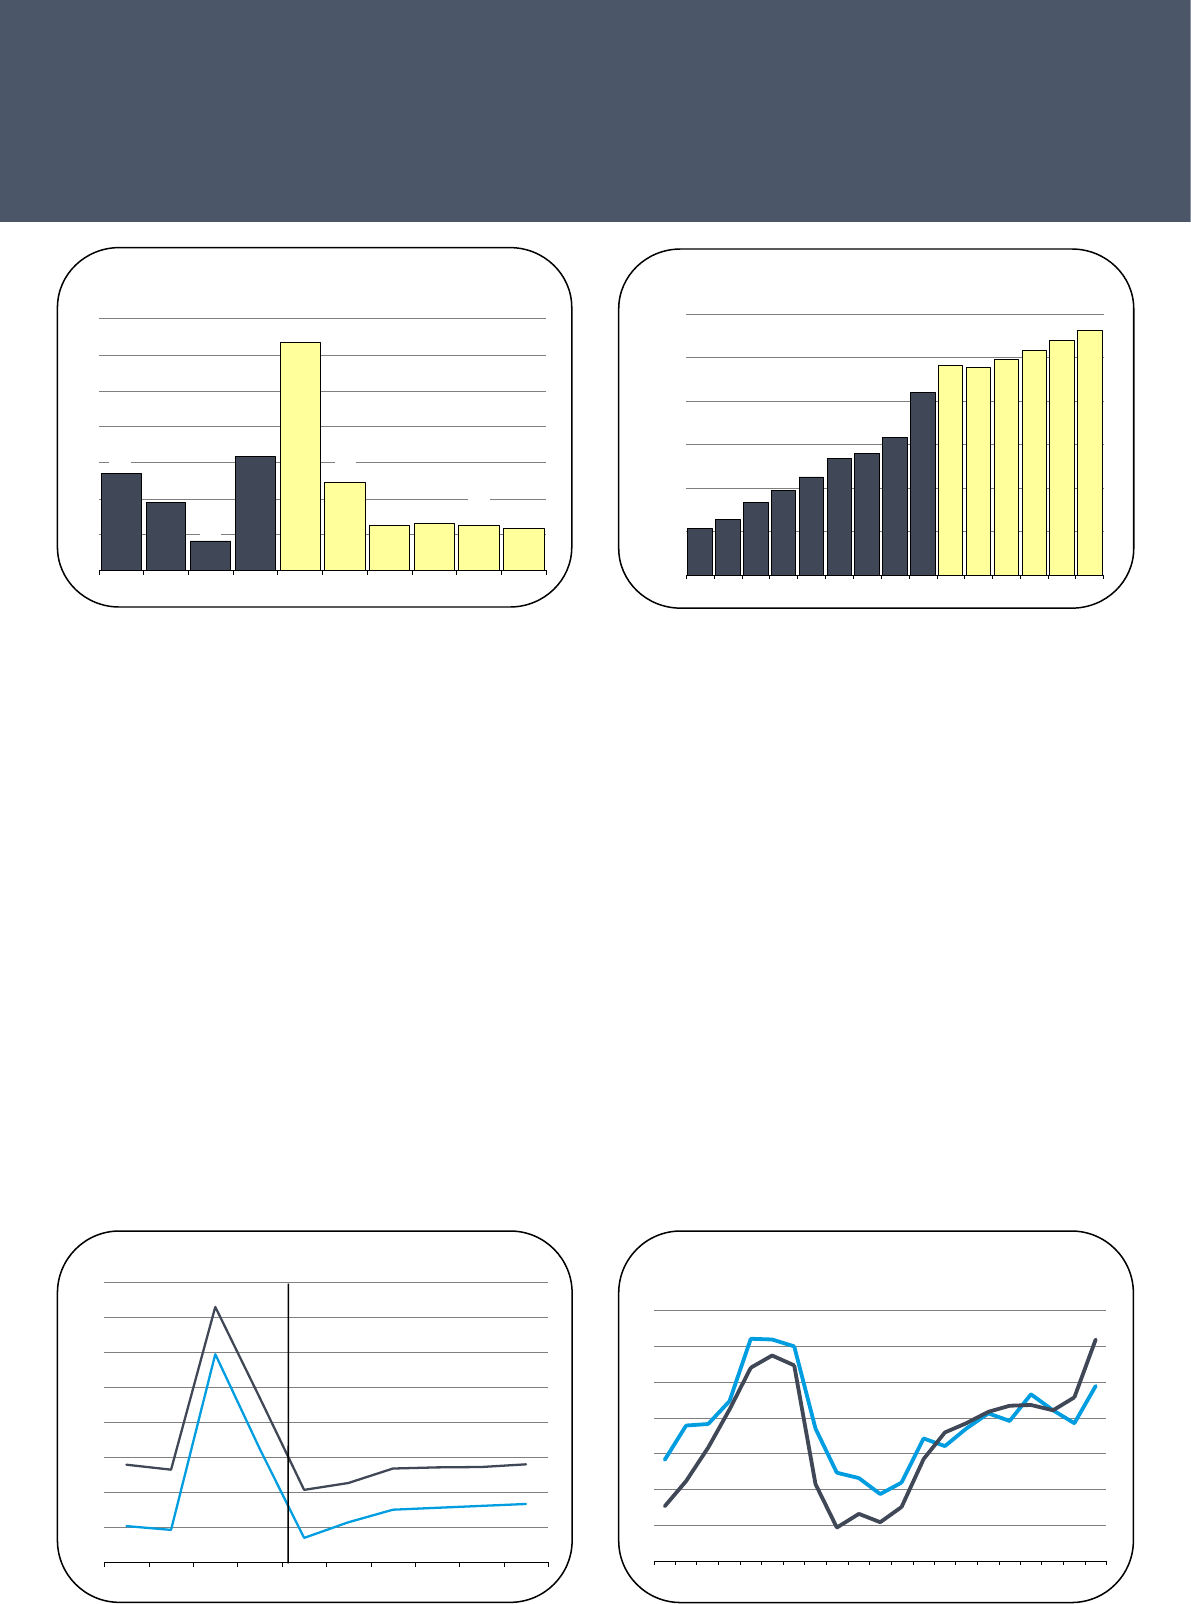
Unemployment and Ination Rates
• The unemployment rate in the county averaged 5.3 percent
in 2021. It is expected to average 2.7 percent in 2022 and 3.1
percent in 2023.
• The unemployment rate in San Luis Obispo County is always lower
than the Central Coast average because San Luis Obispo County
has a larger share of workers with college degrees.
• An unemployment rate below 4.0 percent signies a fully employed
workforce in San Luis Obispo County.
• Ination soared in 2021 and is expected to remain elevated in
2022 and 2023.
• During 2022 and into 2023, there will be a number of factors
that will contribute to higher-than-normal ination. The most
prominent will be:
– Spending by consumers and the federal government that was
especially prolic in 2021 and 2022
– Global supply chain interruptions (from the pandemic) that
have raised the cost of production for many businesses
– Sharp increases in the cost of housing and energy
– Labor market recruitment challenges that have led to surging
wage increases
• Combined, these factors have pushed 2022 ination to its highest
rate in 40 years. Ultimately, ination reduces the purchasing power
of households and negatively impacts consumer condence,
limiting the growth potential of the economy in 2022 and 2023.
• However, ination will gradually decelerate in 2023 as supply
chains are restored, and the impending economic slowdown
moderates the demand for labor and wage increases. Average
ination rates eventually decline to 3 percent again by 2024.
3.7
2.9
1.8
4.2
7.3
3.5
2.3 2.3
2.3
2.2
1
2
3
4
5
6
7
8
2018 2019 2020 2021 2022 2023 2024 2025 2026 2027
Inflation / California
2018 - 2027
percent
change
in CPI
3
4
5
6
7
8
9
10
2001 2003 2005 2007 2009 2011 2013 2015 2017 2019 2021
Home Price to Income Ratio
2001 - 2021
median home price to
median family income
San Luis Obispo County
California
2
3
4
5
6
7
8
9
10
2018 2019 2020 2021 2022 2023 2024 2025 2026 2027
Unemployment Rate
2018 - 2027
percent
San Luis Obispo County
Central Coast
forecast
350,000
450,000
550,000
650,000
750,000
850,000
950,000
2013 2015 2017 2019 2021 2023 2025 2027
Median Home Price
2013 - 2027
dollars

2022 COUNTY-LEVEL ECONOMIC FORECAST
San Luis Obispo County Economic Forecast
7 |
Home Prices and New Housing Production
• The median home selling price in San Luis Obispo County was
$771,000 in 2021 and $881,000 in 2022.
• The median price increased by 16 percent in 2021, which was
actually slower than both the statewide average and adjacent
Santa Barbara County, where selling values increased by an
average of 19 percent.
• Home prices will rise between 7 percent and 8 percent in 2022.
In the City of San Luis Obispo, the October 2022 median selling
value was $1.01 million.
• With the sharp increase in median household income in 2021 and
2022, housing affordability had modestly improved. However,
affordability adjusted for the high rates of ination in the spring
and summer months of 2022 has reversed.
• From 2016 to 2021, an average of 945 new homes were started
per year in San Luis Obispo County. Approximately 70 percent
were single-family homes.
• Housing production is expected to average between 1,000 and
1,100 homes per year from 2022 to 2027, consisting primarily of
single-family homes.
• The City of San Luis Obispo has nearly 3,000 residential units in
the development pipeline despite substantial home building over
the last 5 years.
• The San Luis Ranch is the largest Mixed-Use project under
development in San Luis Obispo County. It is planned to contain
577 residential units, 200,000 square feet of commercial space,
and 150,000 square feet of retail space. The 577 units will be
single- and multi-family homes.
• The 577 residential units are under construction now and are
planning to be completed over the next 4 years.
• The Avila Ranch housing development is currently the largest
housing project underway in San Luis Obispo. It is approved for
720 housing units, 20,000 square feet of commercial space, and
9 new parks.
• Currently 297 single-unit residences are under construction. The
entire Avila Ranch Project isn’t expected to be completed until
2032.
0
400
800
1,200
1,600
2,000
2005 2007 2009 2011 2013 2015 2017 2019 2021 2023 2025 2027
New Homes Permitted
2005 - 2027
homes
permitted
forecast
Single-Family Units
Multifamily Units
70
80
90
100
110
2010 2012 2014 2016 2018 2020 2022
Median Family Income
2010 - 2022
thousands
of dollars
The San Luis Ranch Project
will include a 40-acre organic
farm, a petting zoo, breweries,
and creameries in the farm
and marketplace areas of
the project. A 10,000 square
foot retail center will be built
together with an outdoor
grandstand for public and
private events.

2022 COUNTY-LEVEL ECONOMIC FORECAST
San Luis Obispo County Economic Forecast
8 |
• Other development projects planned in the City of San Luis Obispo
include:
1. Froom Ranch (site work is now underway)
– 404 independent and senior living units
– 174 multi-family units
– 120 room hotel
2. 600 Tank Farm Road Project (under building review)
– 15,000 square feet of commercial space
– 280 Residential Units
3. Prado Business Park (under building review)
– 159,663 square feet industrial/ ofce space
4. Bullock Ranch (under building review)
– 192 residential units
5. Righetti Ranch (under construction)
– 304 residential units
• The Dana Reserve is a formally proposed project that would
deliver 1,289 housing units and 200,000 square feet of commercial
buildings on 288 acres in Nipomo, an unincorporated town in
southern San Luis Obispo County. The project would include
a satellite campus for Cuesta College. The Draft EIR has been
completed. If approved, the project could break ground with
sitework as early as 2023.
Wine Grapes
• San Luis Obispo Coast had been recognized as the newest
American Vinicultural Area by the U.S Alcohol and Tobacco Tax
and Trade Bureau. The fruit and nut agricultural sector had a
record year in 2021, as strawberries remained the top valued
crop in the county and number 2 wine grapes rebounded from a
difcult year in 2020.
• Favorable growing conditions, despite the drought, led to increased
yields for all grape varieties, and together with rising prices
generated a strong year for wine grapes.
Diablo Canyon Power Plant
• The nuclear power plant generates approximately 9 percent of the
state’s electricity and has been in operation since 1985. Currently,
the plant employs 1,100 workers in San Luis Obispo County, a
decline from 1,400 workers in 2019. It is the only nuclear power
plant remaining in California.
• The power plant was scheduled for a complete shutdown of both
energy producing units by 2025. However, on September 1, 2022,
Gavin Newsom signed into law SB846 which will keep the plant
open until 2030 and extend a $1.4 billion loan to the operator
PG&E to do so. Despite this extension, the state has also directed
the continued work of planning for the ultimate decommissioning
of the plant.
• The extension will enable PG&E to remain as the largest employer
in the county with very high paying jobs and signicant multiplier
effects on the region’s economy.
80
120
160
200
240
280
2011 2013 2015 2017 2019 2021
Wine Grape Value / San Luis Obispo County
2011 -- 2021
millions of
dollars
0
75
150
225
300
375
450
525
600
2004 2007 2010 2013 2016 2019 2022
New Residential Units / San Luis Obispo City
2004 -- 2022
units
permitted

2022 COUNTY-LEVEL ECONOMIC FORECAST
9 |
San Luis Obispo County Economic Forecast
Economic Indicators 2015-2021 History, 2022-2050 Forecast
Taxable Total Real Real Real
House- Net New Homes Registered Personal Retail Taxable Industrial per Capita Unemployment Farm Ination
Population holds Migration Permitted Vehicles Income Sales Sales Production Income Rate Production Rate
(people) (thousands) (people) (homes) (thousands) (billions) (billions) (billions) (billions) (dollars) (percent) (billions) (percent)
2015 279,800 104.9 624 880 304 $15.1 $3.6 $5.2 $4.5 $61,311 4.8 $1.0 0.9
2016 281,681 105.6 1,548 933 311 $15.5 $3.7 $5.3 $4.4 $61,537 4.3 $1.1 1.9
2017 282,103 106.3 417 1,098 309 $16.3 $3.9 $5.5 $4.3 $62,829 3.6 $1.0 2.8
2018 282,952 106.8 824 745 311 $17.1 $4.0 $5.6 $4.4 $63,284 3.0 $1.1 3.8
2019 282,617 107.9 -318 935 317 $17.9 $4.1 $5.7 $4.0 $64,483 2.9 $1.0 3.1
2020 282,996 108.7 336 940 313 $18.2 $4.2 $5.7 $4.1 $64,385 7.9 $1.0 1.6
2021 278,607 109.5 -4,109 1,024 318 $19.0 $5.0 $6.9 $4.1 $65,552 5.3 $1.1 3.8
2022 276,763 110.3 -1,755 1,212 324 $20.1 $5.7 $7.9 $4.1 $65,343 2.7 $1.1 7.2
2023 276,560 111.3 -174 1,127 326 $21.1 $5.8 $8.2 $4.1 $66,134 3.1 $1.2 3.4
2024 276,944 112.2 426 1,059 326 $21.9 $5.9 $8.3 $4.1 $67,394 3.5 $1.2 2.2
2025 277,527 113.2 672 1,052 328 $22.9 $5.9 $8.4 $4.2 $68,779 3.6 $1.2 2.2
2026 277,998 114.1 622 987 329 $23.9 $6.0 $8.4 $4.2 $70,071 3.6 $1.2 2.2
2027 278,481 115.0 700 995 330 $24.9 $6.0 $8.5 $4.3 $71,214 3.7 $1.2 2.1
2028 278,636 115.9 448 934 331 $25.8 $6.1 $8.6 $4.4 $72,377 3.7 $1.2 2.1
2029 278,745 116.8 457 893 332 $26.6 $6.2 $8.7 $4.4 $73,029 3.7 $1.2 2.2
2030 278,799 117.6 463 849 333 $27.5 $6.4 $9.0 $4.5 $73,694 3.7 $1.2 2.1
2031 278,756 118.3 466 805 333 $28.2 $6.5 $9.2 $4.5 $74,323 3.7 $1.2 2.0
2032 278,603 119.1 468 759 333 $29.0 $6.7 $9.4 $4.5 $74,718 3.7 $1.2 2.2
2033 278,352 119.8 470 725 335 $29.8 $6.8 $9.6 $4.5 $75,555 3.6 $1.2 1.8
2034 277,986 120.4 476 690 338 $30.7 $7.0 $9.8 $4.6 $76,278 3.5 $1.2 2.0
2035 277,529 121.1 484 691 340 $31.6 $7.2 $10.1 $4.6 $77,003 3.5 $1.2 2.1
2036 276,989 121.7 495 657 340 $32.5 $7.4 $10.4 $4.6 $77,408 3.4 $1.3 2.5
2037 276,391 122.3 508 697 338 $33.4 $7.6 $10.7 $4.6 $77,690 3.4 $1.3 2.6
2038 275,727 122.9 522 701 338 $34.3 $7.9 $11.0 $4.6 $78,149 3.4 $1.3 2.4
2039 275,013 123.5 536 705 337 $35.2 $8.1 $11.4 $4.6 $78,420 3.4 $1.3 2.6
2040 274,236 124.1 549 667 336 $36.1 $8.3 $11.6 $4.7 $78,728 3.4 $1.3 2.5
2041 273,393 124.7 561 673 335 $37.1 $8.5 $11.9 $4.7 $79,326 3.4 $1.3 2.1
2042 272,499 125.3 573 668 334 $38.0 $8.6 $12.2 $4.7 $79,915 3.4 $1.3 2.0
2043 271,567 125.9 584 661 332 $38.9 $8.8 $12.4 $4.7 $80,599 3.4 $1.3 1.9
2044 270,600 126.5 594 660 331 $39.8 $9.0 $12.7 $4.7 $81,397 3.4 $1.3 1.7
2045 269,594 127.1 604 641 330 $40.7 $9.2 $12.9 $4.8 $82,126 3.4 $1.3 1.8
2046 268,559 127.6 615 621 329 $41.7 $9.4 $13.2 $4.8 $82,765 3.4 $1.3 1.9
2047 267,497 128.2 626 618 327 $42.6 $9.6 $13.5 $4.8 $83,156 3.3 $1.3 2.1
2048 266,406 128.8 637 615 326 $43.6 $9.9 $13.9 $4.8 $83,548 3.3 $1.3 2.2
2049 265,278 129.3 647 611 324 $44.5 $10.1 $14.2 $4.8 $84,153 3.3 $1.3 1.9
2050 264,111 129.8 656 606 323 $45.5 $10.3 $14.5 $4.8 $84,727 3.3 $1.3 2.0
Total Wage Manufac- Transportation Wholesale & Financial Professional Health &
& Salary Farm Construction turing & Utilities Retail Trade Activities Services Information Education Leisure Government
----------------------------------------------------------------------------------------------------(thousands of jobs) ----------------------------------------------------------------------------------------
2015 116.4 5.04 6.7 7.0 4.0 16.7 3.9 10.1 1.5 16.5 17.6 23.6
2016 118.8 4.84 7.2 7.0 4.1 16.9 3.8 10.5 1.3 17.0 18.5 23.9
2017 121.5 5.23 7.5 7.3 4.0 17.1 3.9 10.7 1.3 17.4 19.1 24.2
2018 123.1 5.16 7.9 7.7 4.1 17.0 3.9 10.9 1.2 17.7 19.2 24.3
2019 124.7 4.95 8.3 7.8 4.1 16.7 3.9 11.2 1.2 18.2 19.8 24.5
2020 114.4 4.83 8.5 7.3 3.7 15.4 3.8 10.5 1.1 17.0 15.4 23.5
2021 119.3 4.92 9.1 7.8 3.7 16.0 3.9 11.0 1.2 17.5 17.4 23.2
2022 123.6 5.01 9.3 8.3 3.8 16.3 4.0 11.6 1.2 18.4 19.1 22.5
2023 125.8 5.27 9.3 8.3 3.9 16.4 3.9 11.8 1.2 18.6 20.1 22.8
2024 126.9 5.31 9.4 8.3 3.9 16.5 3.9 11.9 1.2 18.7 20.6 23.1
2025 128.1 5.36 9.3 8.3 3.9 16.5 3.9 12.0 1.2 18.8 20.9 23.9
2026 128.9 5.39 9.3 8.3 4.0 16.4 3.9 12.1 1.2 18.9 21.0 24.5
2027 129.5 5.41 9.2 8.3 4.0 16.4 3.9 12.1 1.2 18.9 21.1 24.9
2028 129.7 5.44 9.1 8.3 4.0 16.3 3.9 12.2 1.2 19.0 21.2 25.0
2029 129.8 5.46 8.9 8.3 4.0 16.3 3.8 12.3 1.2 19.1 21.2 25.1
2030 129.9 5.49 8.8 8.3 4.0 16.3 3.8 12.3 1.2 19.1 21.3 25.1
2031 130.1 5.52 8.6 8.3 4.0 16.3 3.8 12.3 1.2 19.2 21.4 25.2
2032 130.2 5.54 8.5 8.3 4.0 16.3 3.8 12.4 1.2 19.2 21.5 25.3
2033 130.4 5.57 8.4 8.3 4.0 16.3 3.8 12.4 1.2 19.3 21.6 25.3
2034 130.6 5.59 8.3 8.3 4.1 16.3 3.7 12.5 1.2 19.5 21.7 25.4
2035 130.9 5.62 8.2 8.3 4.1 16.2 3.7 12.5 1.2 19.6 21.8 25.4
2036 131.0 5.64 8.0 8.4 4.1 16.2 3.7 12.5 1.2 19.7 21.9 25.5
2037 131.0 5.67 8.0 8.4 4.1 16.1 3.7 12.6 1.2 19.6 22.0 25.5
2038 131.1 5.69 8.0 8.4 4.1 16.1 3.8 12.6 1.2 19.5 22.1 25.5
2039 131.3 5.72 7.9 8.4 4.1 16.1 3.8 12.6 1.2 19.5 22.2 25.6
2040 131.3 5.74 7.9 8.4 4.1 16.1 3.7 12.7 1.2 19.5 22.2 25.6
2041 131.5 5.77 7.8 8.4 4.1 16.1 3.7 12.7 1.2 19.4 22.3 25.7
2042 131.6 5.79 7.8 8.4 4.1 16.1 3.7 12.7 1.2 19.4 22.4 25.7
2043 131.6 5.81 7.8 8.4 4.1 16.0 3.7 12.8 1.2 19.3 22.5 25.8
2044 131.7 5.84 7.8 8.4 4.1 16.0 3.7 12.8 1.2 19.2 22.6 25.8
2045 131.8 5.86 7.8 8.5 4.1 16.0 3.7 12.8 1.2 19.1 22.7 25.9
2046 131.8 5.89 7.7 8.5 4.1 16.0 3.7 12.8 1.2 19.1 22.7 25.9
2047 131.9 5.91 7.7 8.5 4.1 16.0 3.7 12.9 1.2 19.0 22.8 26.0
2048 132.0 5.93 7.7 8.5 4.1 15.9 3.7 12.9 1.2 18.9 22.9 26.0
2049 132.1 5.96 7.7 8.5 4.1 15.9 3.7 12.9 1.2 18.9 23.0 26.1
2050 132.2 5.98 7.6 8.5 4.1 15.9 3.7 12.9 1.2 18.8 23.1 26.1
Employment Sectors 2015-2021 History, 2022-2050 Forecast
2022 COUNTY-LEVEL ECONOMIC FORECAST
10 |
San Luis Obispo County Economic Forecast
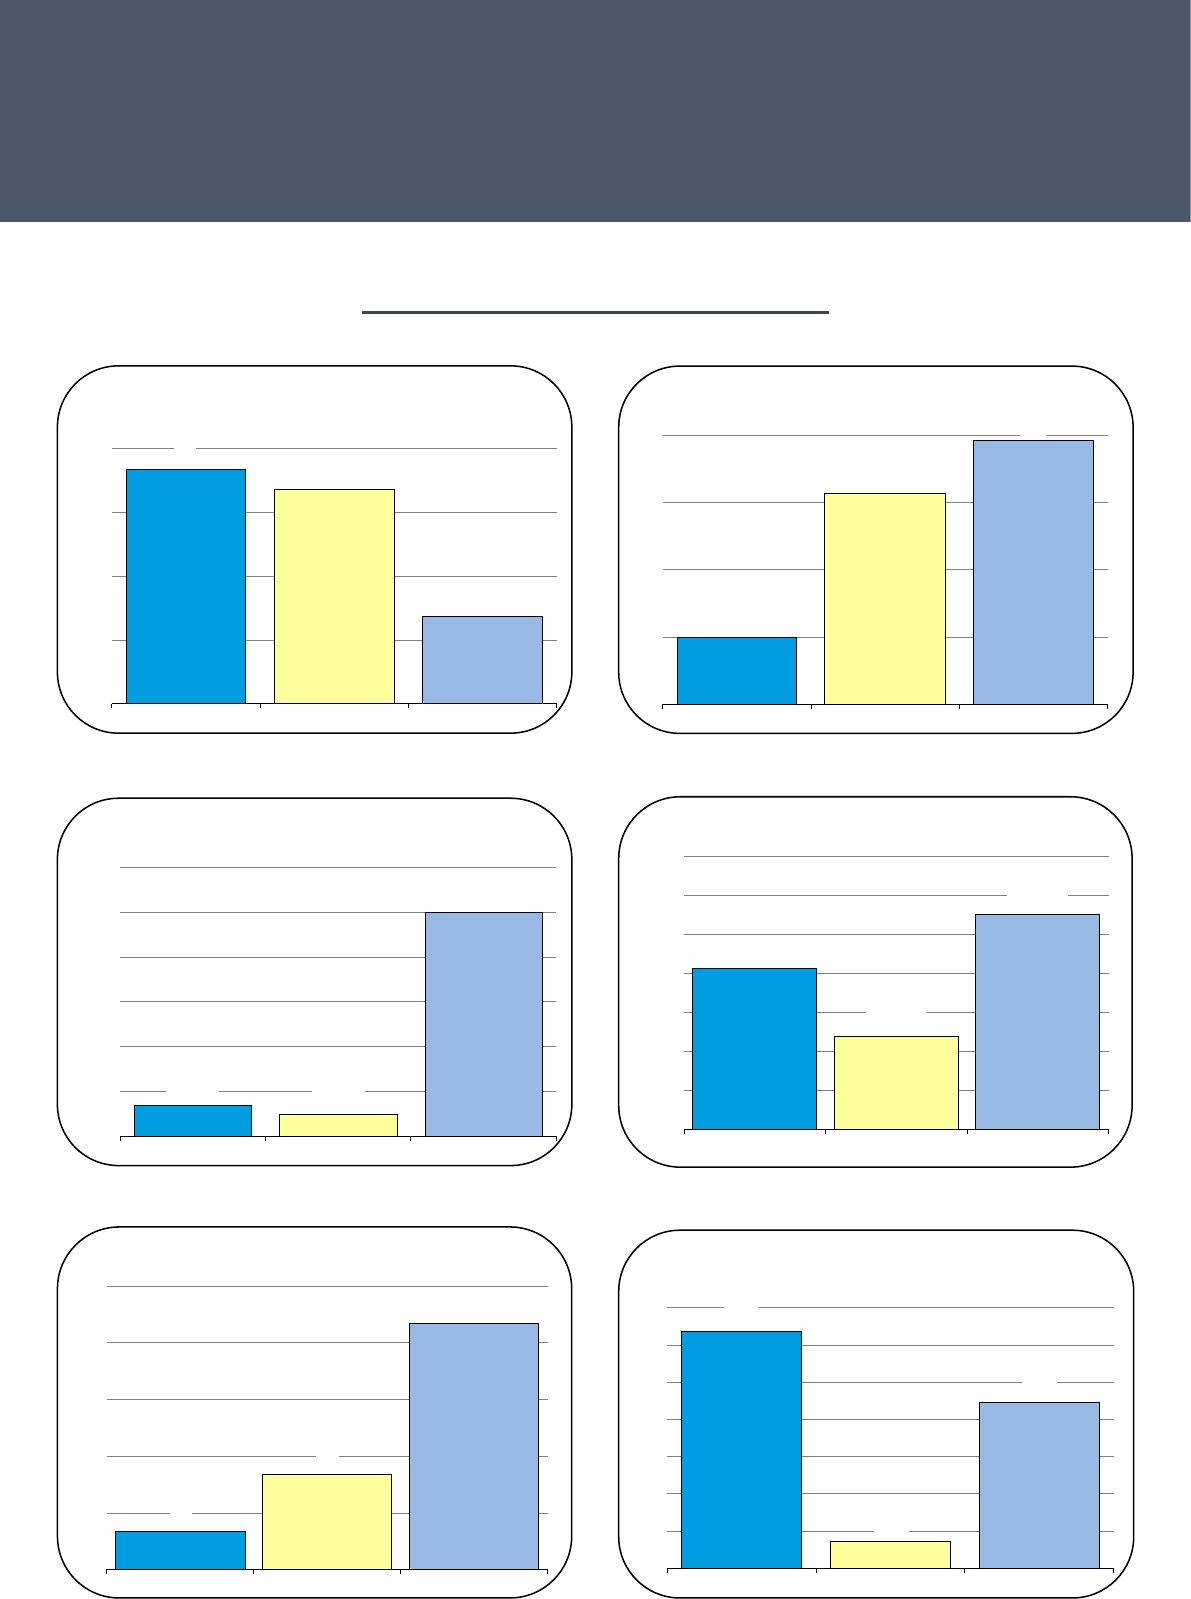
Socioeconomic Indicators
6.0
8.1
8.9
5
6
7
8
9
San Luis Obispo County Central Coast California
Poverty Rate
2022
percent of
households below
poverty line
84,700
84,500
89,000
84,000
85,000
86,000
87,000
88,000
89,000
90,000
San Luis Obispo County Central Coast California
Median Household Income
2022
dollars per
household
22
25
33
20
23
26
29
32
35
San Luis Obispo County Central Coast California
Average Travel Time to Work
2022
minutes
each way
36.4
30.7
34.5
30
31
32
33
34
35
36
37
San Luis Obispo County Central Coast California
Percent of Population Age 25+
With at Least a 4-Year College Degree
2022
percent
57
54
34
20
30
40
50
60
San Luis Obispo County Central Coast California
Students Proficient in English Language Arts/Literacy
Grades 3-8 & 11
2022
percent of
students tested
771,259
754,000
785,000
730,000
740,000
750,000
760,000
770,000
780,000
790,000
800,000
San Luis Obispo County Central Coast California
Median Home Selling Price
2021
dollars
